#LTC/USDT
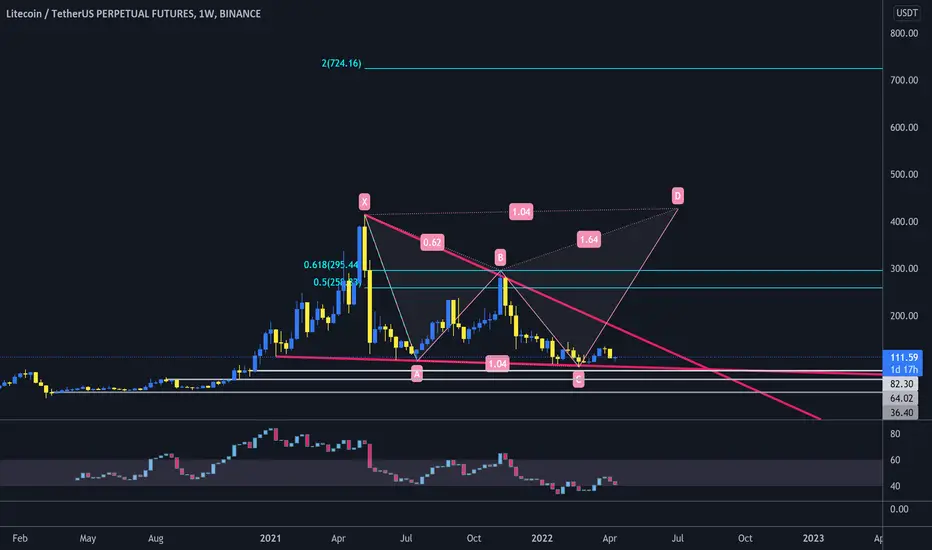
 LTC weekly chart shows price is at bottom and above lower line of triangle.
🐮 holding the lower line of triangle as support can increase price toward upper line around $150.
break out from upper line of triangle will confirm double bottom pattern and will head up price toward $400 and $700.
🐻 break down from lower line will drop price to supports shown in chart.
🐮 holding the lower line of triangle as support can increase price toward upper line around $150.
break out from upper line of triangle will confirm double bottom pattern and will head up price toward $400 and $700.
🐻 break down from lower line will drop price to supports shown in chart.
Penafian
Maklumat dan penerbitan adalah tidak dimaksudkan untuk menjadi, dan tidak membentuk, nasihat untuk kewangan, pelaburan, perdagangan dan jenis-jenis lain atau cadangan yang dibekalkan atau disahkan oleh TradingView. Baca dengan lebih lanjut di Terma Penggunaan.
Penafian
Maklumat dan penerbitan adalah tidak dimaksudkan untuk menjadi, dan tidak membentuk, nasihat untuk kewangan, pelaburan, perdagangan dan jenis-jenis lain atau cadangan yang dibekalkan atau disahkan oleh TradingView. Baca dengan lebih lanjut di Terma Penggunaan.
