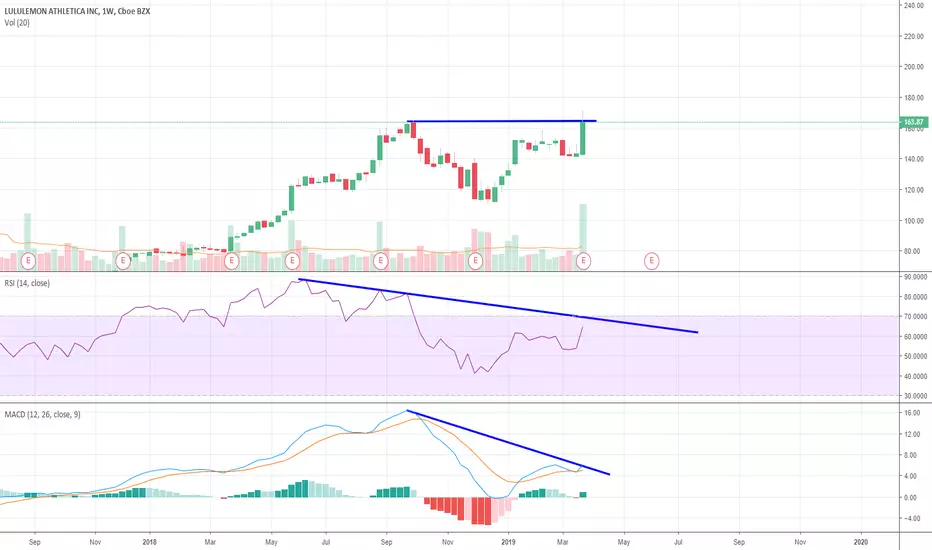
LULU Showing signs of double topping & Bubble Deflation.

The price action on the weekly chart clearly shows we have a double top on the candlestick bodies and a stark and merciless incidence of classic bearish divergence. The RSI does appear to have a resistance line it began to set in May of last year and that does give some more wiggle room for perhaps a couple of small green weekly candles.
A look at the daily chart shows that the RSI resistance is still very present and it predicts a downturn from the current level. The blue is divergence from within the current top and the orange is long term divergence from the other top, so the second top has internal divergence to tear it apart, and it divergence from the first top. As a general rule “gaps get filled” and the price action gapped up and that distance should generally be filled. A look at the volume profile also shows there is not a whole lot of volume holding this uptrend up and our next High Volume node is at 125. We might see some distribution there if the indicators show some bullish divergence but I think that would be a bull trap as we continue down to $80 or even lower as the LULU bubble deflates

Moving average traders should be watching for a bearish cross of the 50 and 200, which came frightfully close. When it does happen I don't think we will see the bear-bull-bear cross combo, I think the bear cross will happen once and be severe, but that is more a strong hunch than a prediction

A look at the daily chart shows that the RSI resistance is still very present and it predicts a downturn from the current level. The blue is divergence from within the current top and the orange is long term divergence from the other top, so the second top has internal divergence to tear it apart, and it divergence from the first top. As a general rule “gaps get filled” and the price action gapped up and that distance should generally be filled. A look at the volume profile also shows there is not a whole lot of volume holding this uptrend up and our next High Volume node is at 125. We might see some distribution there if the indicators show some bullish divergence but I think that would be a bull trap as we continue down to $80 or even lower as the LULU bubble deflates
Moving average traders should be watching for a bearish cross of the 50 and 200, which came frightfully close. When it does happen I don't think we will see the bear-bull-bear cross combo, I think the bear cross will happen once and be severe, but that is more a strong hunch than a prediction
Nota
First the weekly chartThe price action took a whopping today and the chart shows that my RSI line held true but my MACD prediction was painfully wrong. The VPVR target in the top posts at 125 and 80 if not lower.
Here is a deeper view into the gaps in LULU. Many have not yet been filled and with the upcoming bear market I think that we have a very real probability in filling the gap around $70. Be patient.
And I promise every Floridian that you will all be rich... because we're gonna print some more money! Why didn't anybody ever think of this before?
~Nathan Explosion
~Nathan Explosion
Penafian
Maklumat dan penerbitan adalah tidak dimaksudkan untuk menjadi, dan tidak membentuk, nasihat untuk kewangan, pelaburan, perdagangan dan jenis-jenis lain atau cadangan yang dibekalkan atau disahkan oleh TradingView. Baca dengan lebih lanjut di Terma Penggunaan.