From the weekly (1W) price chart of Microvast Holdings, Inc. (MVST) stock, we can observe significant developments indicating potential upward price movement in the future.
Breaking Through Strong Resistance (Yellow Zone):
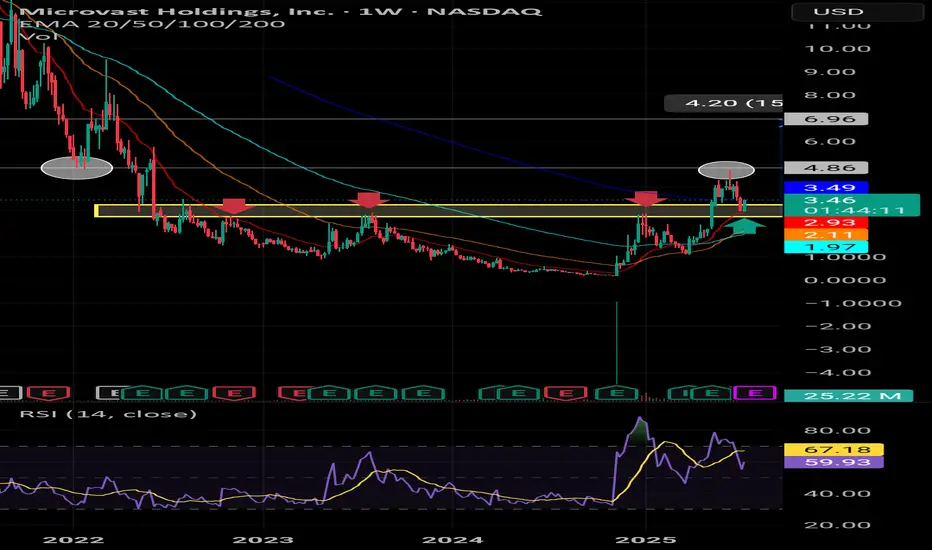
Previously, MVST's stock price was under pressure and repeatedly failed to break above the "yellow zone." This is evident from the three red arrows indicating multiple unsuccessful attempts. This zone, therefore, served as a strong and highly significant resistance level in the past.
However, recent price action clearly shows that the price has successfully broken through this yellow zone. This is a highly positive signal, indicating a shift in momentum. It is anticipated that once this old resistance is breached, the yellow zone will transform into a crucial "support level" in the future, helping to prevent the price from easily falling back below it.
Clearing Selling Pressure from Bag Holders:
Historically, the price once touched the area marked by the "circle" before sharply declining. The probable reason for this was a large number of investors who had bought the stock at higher prices and had been "holding at a loss" (bag holders) for a long time. They decided to "sell off" to realize profits when the price recovered, or to cut their losses. This type of selling is a common phenomenon when a stock recovers from its lows.
Current Positive Signals:
The current ability of the price to break above the yellow zone, after the selling pressure from these long-term holders has largely been absorbed, indicates that significant buying interest has returned and is now stronger than the selling pressure.
How Far Can MVST Soar?
With this break above a significant resistance and the growing buying momentum, the chart displays a potential target at the 4.20 USD level, which is substantially higher than the current price. Nevertheless, investors should also monitor the trading volume to confirm the strength of this upward trend and consider other fundamental factors of the company before making investment decisions.
Conclusion:
The overall chart analysis suggests that MVST is transitioning from a stagnant trend to a clear upward trend. The breakthrough of significant resistance and the reduction in selling pressure from long-term holders position MVST for potential appreciation to higher price levels in the near future.
Breaking Through Strong Resistance (Yellow Zone):
Previously, MVST's stock price was under pressure and repeatedly failed to break above the "yellow zone." This is evident from the three red arrows indicating multiple unsuccessful attempts. This zone, therefore, served as a strong and highly significant resistance level in the past.
However, recent price action clearly shows that the price has successfully broken through this yellow zone. This is a highly positive signal, indicating a shift in momentum. It is anticipated that once this old resistance is breached, the yellow zone will transform into a crucial "support level" in the future, helping to prevent the price from easily falling back below it.
Clearing Selling Pressure from Bag Holders:
Historically, the price once touched the area marked by the "circle" before sharply declining. The probable reason for this was a large number of investors who had bought the stock at higher prices and had been "holding at a loss" (bag holders) for a long time. They decided to "sell off" to realize profits when the price recovered, or to cut their losses. This type of selling is a common phenomenon when a stock recovers from its lows.
Current Positive Signals:
The current ability of the price to break above the yellow zone, after the selling pressure from these long-term holders has largely been absorbed, indicates that significant buying interest has returned and is now stronger than the selling pressure.
How Far Can MVST Soar?
With this break above a significant resistance and the growing buying momentum, the chart displays a potential target at the 4.20 USD level, which is substantially higher than the current price. Nevertheless, investors should also monitor the trading volume to confirm the strength of this upward trend and consider other fundamental factors of the company before making investment decisions.
Conclusion:
The overall chart analysis suggests that MVST is transitioning from a stagnant trend to a clear upward trend. The breakthrough of significant resistance and the reduction in selling pressure from long-term holders position MVST for potential appreciation to higher price levels in the near future.
Penafian
Maklumat dan penerbitan adalah tidak dimaksudkan untuk menjadi, dan tidak membentuk, nasihat untuk kewangan, pelaburan, perdagangan dan jenis-jenis lain atau cadangan yang dibekalkan atau disahkan oleh TradingView. Baca dengan lebih lanjut di Terma Penggunaan.
Penafian
Maklumat dan penerbitan adalah tidak dimaksudkan untuk menjadi, dan tidak membentuk, nasihat untuk kewangan, pelaburan, perdagangan dan jenis-jenis lain atau cadangan yang dibekalkan atau disahkan oleh TradingView. Baca dengan lebih lanjut di Terma Penggunaan.