Context:
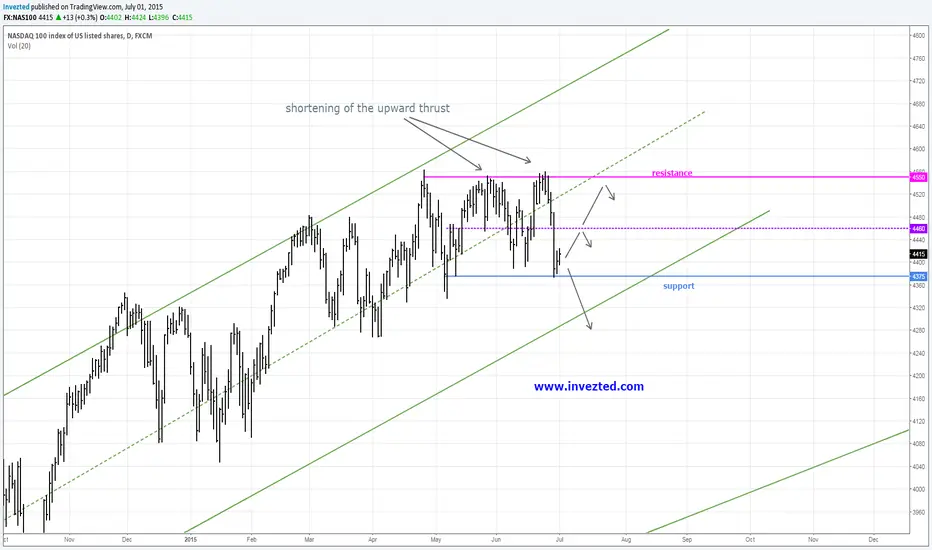
price is came to an halt in its upward progress indicated by the shortening of the upward
thrust , ie. it failed to test the overbought levels of the channel , and found resistance at
4550 , on the other hand price also found support at 4375 , which contains the price in a range
the last selloff was sharp and any further weakness at or near the "mean" of the range at 4460
should be considered weak , if price then breaks support and teh channel lows , we can speak of the beginning
of a bear market. till then its safe to lookout for trades at the extremes.
Signs of strength:
uptrend
support holds
Signs Of weakness:
shortening of the upward thrust
resistance holds
Support:
4375
4280
4200
Resistance:
4550
invezted.com
Penafian
Maklumat dan penerbitan adalah tidak dimaksudkan untuk menjadi, dan tidak membentuk, nasihat untuk kewangan, pelaburan, perdagangan dan jenis-jenis lain atau cadangan yang dibekalkan atau disahkan oleh TradingView. Baca dengan lebih lanjut di Terma Penggunaan.
Penafian
Maklumat dan penerbitan adalah tidak dimaksudkan untuk menjadi, dan tidak membentuk, nasihat untuk kewangan, pelaburan, perdagangan dan jenis-jenis lain atau cadangan yang dibekalkan atau disahkan oleh TradingView. Baca dengan lebih lanjut di Terma Penggunaan.