A multi-stage forecast model for the US Tech 100 Cash (NASDAQ) based on price cycles and distribution levels, likely derived from Wyckoff - style market phases. Here’s a structured summary:
NASDAQ 100 – Multi-Stage Price Forecast (USD)
Ticker: NASDAQ | Trading Venue: IG
Market Structure Overview
The model is divided into three main phases:
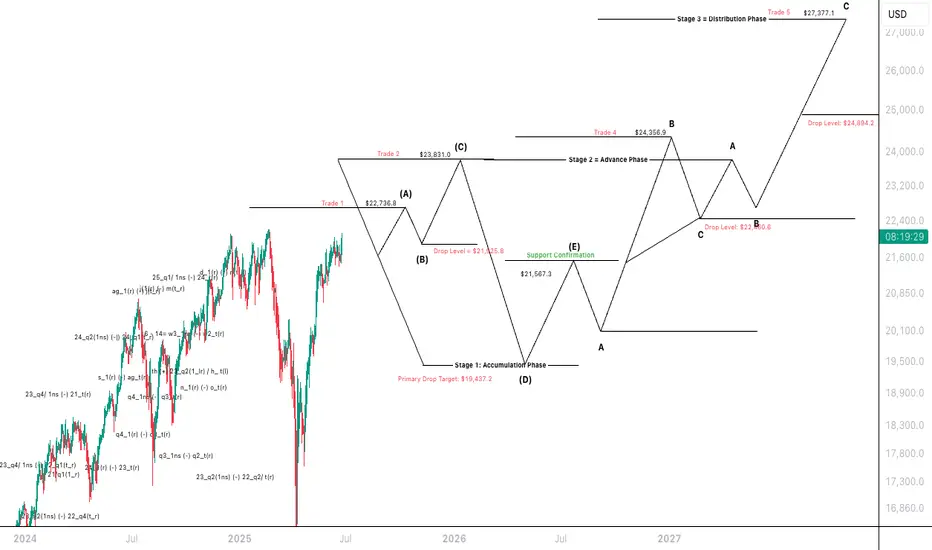
Stage 1 – Accumulation Phase
Stage 2 – Advance Phase
Stage 3 – Distribution Phase
Forecasted Trade & Price Levels
Stage 1: Accumulation Phase
Primary Drop Target: $19,437.2
Intermediate Drop Level: $21,965.8
Support Confirmation: $21,567.3
This stage ends with an upward movement from point (D) to (E), confirming support.
Stage 2: Advance Phase
Begins after Support Confirmation.
Key upward levels:
$22,736.8 → Trade 1
$23,831.0 → Trade 2
$24,366.9 → Trade 4
Drop Level during this phase: $22,480.6
Stage 3: Distribution Phase
Targets higher price levels before a major drop:
Final high: $27,377.1 → Trade 5
Critical drop level: $24,894.2
Cycle-Level Forecasting
Distribution Phase Trigger Level: $22,736.8
2nd Cycle Distribution Levels
$23,831.0
$24,065.4
$24,366.9
$24,856.5
$27,377.1
$28,925.6
$29,956.5
3rd Cycle Forecast (Higher Projections)
$28,874.1
$29,804.1
$30,610.4
$30,845.1
$31,450.0
$30,770.2
4th Cycle Forecast
$31,317.6
$31,810.6
$32,219.6
$32,682.1
$32,870.6
$32,179.6
Interpretation & Implications
This forecast model suggests a major cyclical rise and fall structure.
Each stage (Accumulation → Advance → Distribution) is followed by price drops at defined levels, signalling strategic trade exits or short positions.
The model maps potential entry/exit trades, labelling them Trade 1 to Trade 5.
Anticipates a strong uptrend towards $27K+, followed by corrections at each drop level (e.g., $24,894.2, $22,480.6).
Disclaimer: The following forecast is derived from a proprietary, hand-crafted mathematical model developed independently over several years. It does not rely on traditional indicators, technical patterns, or third-party frameworks such as Elliott Wave Theory.
This model calculates price action based on distribution phases, economic timing cycles, and natural market imbalances.
NASDAQ 100 – Multi-Stage Price Forecast (USD)
Ticker: NASDAQ | Trading Venue: IG
Market Structure Overview
The model is divided into three main phases:
Stage 1 – Accumulation Phase
Stage 2 – Advance Phase
Stage 3 – Distribution Phase
Forecasted Trade & Price Levels
Stage 1: Accumulation Phase
Primary Drop Target: $19,437.2
Intermediate Drop Level: $21,965.8
Support Confirmation: $21,567.3
This stage ends with an upward movement from point (D) to (E), confirming support.
Stage 2: Advance Phase
Begins after Support Confirmation.
Key upward levels:
$22,736.8 → Trade 1
$23,831.0 → Trade 2
$24,366.9 → Trade 4
Drop Level during this phase: $22,480.6
Stage 3: Distribution Phase
Targets higher price levels before a major drop:
Final high: $27,377.1 → Trade 5
Critical drop level: $24,894.2
Cycle-Level Forecasting
Distribution Phase Trigger Level: $22,736.8
2nd Cycle Distribution Levels
$23,831.0
$24,065.4
$24,366.9
$24,856.5
$27,377.1
$28,925.6
$29,956.5
3rd Cycle Forecast (Higher Projections)
$28,874.1
$29,804.1
$30,610.4
$30,845.1
$31,450.0
$30,770.2
4th Cycle Forecast
$31,317.6
$31,810.6
$32,219.6
$32,682.1
$32,870.6
$32,179.6
Interpretation & Implications
This forecast model suggests a major cyclical rise and fall structure.
Each stage (Accumulation → Advance → Distribution) is followed by price drops at defined levels, signalling strategic trade exits or short positions.
The model maps potential entry/exit trades, labelling them Trade 1 to Trade 5.
Anticipates a strong uptrend towards $27K+, followed by corrections at each drop level (e.g., $24,894.2, $22,480.6).
Disclaimer: The following forecast is derived from a proprietary, hand-crafted mathematical model developed independently over several years. It does not rely on traditional indicators, technical patterns, or third-party frameworks such as Elliott Wave Theory.
This model calculates price action based on distribution phases, economic timing cycles, and natural market imbalances.
Institutional Note:
For institutional review, independent verification, or strategic collaboration:
institutions@bmoses.com.au
For institutional review, independent verification, or strategic collaboration:
institutions@bmoses.com.au
Penafian
Maklumat dan penerbitan adalah tidak dimaksudkan untuk menjadi, dan tidak membentuk, nasihat untuk kewangan, pelaburan, perdagangan dan jenis-jenis lain atau cadangan yang dibekalkan atau disahkan oleh TradingView. Baca dengan lebih lanjut di Terma Penggunaan.