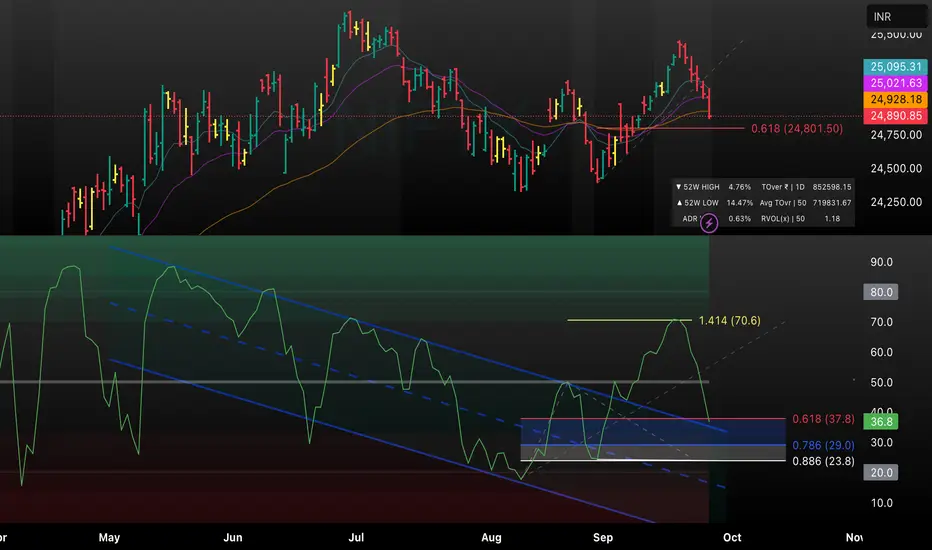
This chart combines price action with key Fibonacci retracement and extension levels to anticipate potential support or reversal zones. Price is currently testing the crucial 0.618 retracement (24,801.50) after a notable downward move. RSI is also reacting near its own significant levels, aligning with both 0.618 on the downside (37.8) and the 1.414 extension (70.6) on the upside. Watch for reactions at these levels for clues on whether price will bounce or continue to the next fib zone, especially with momentum indicators confirming support/resistance confluence.
Penafian
Maklumat dan penerbitan adalah tidak dimaksudkan untuk menjadi, dan tidak membentuk, nasihat untuk kewangan, pelaburan, perdagangan dan jenis-jenis lain atau cadangan yang dibekalkan atau disahkan oleh TradingView. Baca dengan lebih lanjut di Terma Penggunaan.
Penafian
Maklumat dan penerbitan adalah tidak dimaksudkan untuk menjadi, dan tidak membentuk, nasihat untuk kewangan, pelaburan, perdagangan dan jenis-jenis lain atau cadangan yang dibekalkan atau disahkan oleh TradingView. Baca dengan lebih lanjut di Terma Penggunaan.