As of the market close on May 9, 2025, the Nifty 50 index stood at 24,008.00, marking a decline of 265.80 points (-1.10%) for the day.
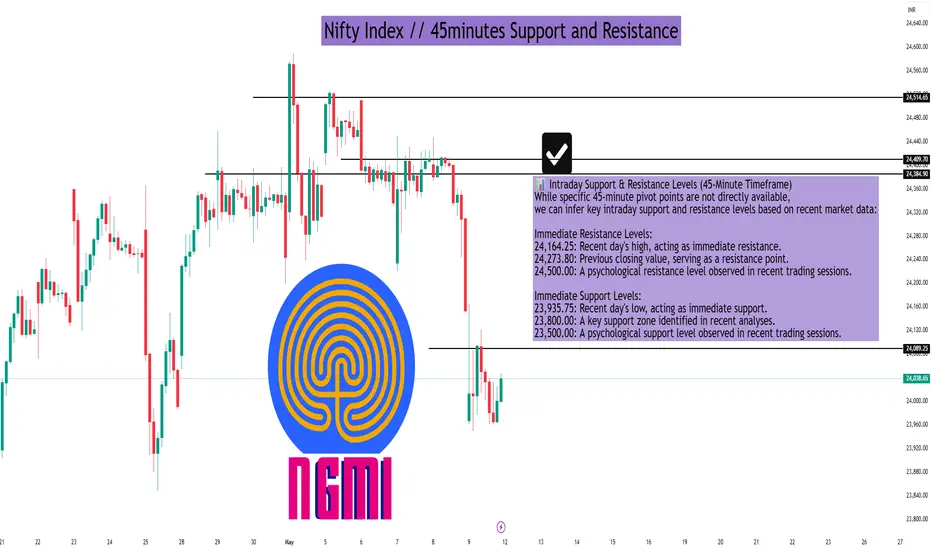
📊 Intraday Support & Resistance Levels (45-Minute Timeframe)
While specific 45-minute pivot points are not directly available, we can infer key intraday support and resistance levels based on recent market data:
Immediate Resistance Levels:
24,164.25: Recent day's high, acting as immediate resistance.
24,273.80: Previous closing value, serving as a resistance point.
24,500.00: A psychological resistance level observed in recent trading sessions.
Immediate Support Levels:
23,935.75: Recent day's low, acting as immediate support.
23,800.00: A key support zone identified in recent analyses.
23,500.00: A psychological support level observed in recent trading sessions.
🔍 Technical Indicators Summary
As per the latest technical analysis:
Relative Strength Index (RSI): 30.201 – Indicates a bearish condition.
Stochastic Oscillator (9,6): 97.279 – Suggests an overbought condition.
MACD (12,26): -105.46 – Indicates a bearish signal.
Average Directional Index (ADX): 47.759 – Suggests a strong trend.
Commodity Channel Index (CCI): -86.2237 – Indicates a bearish condition.
These indicators collectively suggest a bearish outlook for the Nifty 50 index in the short term.
📈 Trading Insights
Resistance Zone: The index faces resistance around the 24,164.25 to 24,273.80 range. A break above this zone could signal bullish momentum.
Support Zone: Support is observed around the 23,935.75 to 23,800.00 range. A breach below this zone may indicate further downside potential.
I built a Buy & Sell Signal Indicator with 85% accuracy.
📈 Get access via DM or
WhatsApp: wa.link/d997q0
| Email: techncialexpress@gmail.com
| Script Coder | Trader | Investor | From India
📈 Get access via DM or
WhatsApp: wa.link/d997q0
| Email: techncialexpress@gmail.com
| Script Coder | Trader | Investor | From India
Penerbitan berkaitan
Penafian
Maklumat dan penerbitan adalah tidak dimaksudkan untuk menjadi, dan tidak membentuk, nasihat untuk kewangan, pelaburan, perdagangan dan jenis-jenis lain atau cadangan yang dibekalkan atau disahkan oleh TradingView. Baca dengan lebih lanjut di Terma Penggunaan.