The Nifty 50 index, a benchmark for the Indian stock market, is expected to exhibit cautious and potentially bearish behaviour for the week of August 11–15, 2025, based on recent market trends, technical analysis, and macroeconomic factors. Below is a detailed analysis for the upcoming week
# Current Market Context
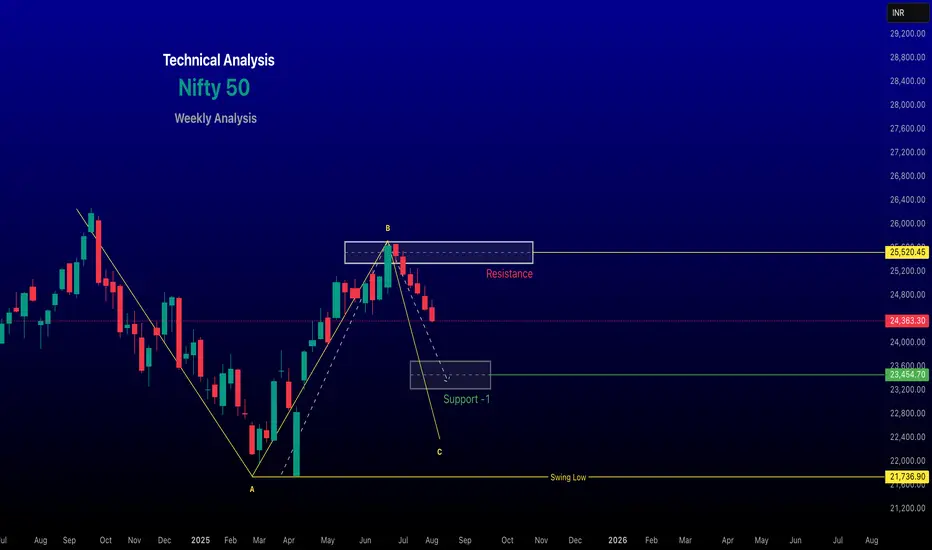
Recent Performance: As of August 8, 2025, the Nifty 50 closed at 24,363.30, down 232.85 points (-0.95%), reflecting a bearish sentiment driven by foreign fund outflows and US-India tariff tensions. The index has been trading within a descending channel, characterised by lower highs and lower lows, indicating short-term weakness.
Technical Indicators:
Weekly Chart: A candle formed on the weekly chart, signalling market Bearish. Confirmation of this pattern could indicate further consolidation or a directional move.
Moving Averages: The Nifty is below its 21-day EMA, suggesting bearish momentum. The 5-day SMA and EMA are around 24,843.75 and 24,865.11, respectively, acting as resistance.
RSI and MACD: RSI is in the 35–40 range, indicating oversold conditions, which could signal a potential short-term bounce. MACD remains bearish, reflecting sustained selling pressure.
Pivot Levels: Key resistance is at 25,600–25,925, with immediate support at 23,250–23,400. A break below 23,200 could push the index toward its 200-day DMA (~23,900).
Market Sentiment: Sentiment is cautious due to:FII Outflows: Foreign Institutional Investors (FIIs) sold equities worth ₹4,997.19 crore on August 7, 2025, exerting downward pressure. Domestic Institutional Investors (DIIs) countered with ₹10,864.04 crore in buys, providing some support.
Global Cues: Mixed global market performance (e.g., NASDAQ down 2.24%, Dow Jones up 0.29% on August 4) and US tariff hikes on Indian imports are weighing on sentiment.
RBI Policy: The upcoming RBI policy decision could influence market direction, particularly if it addresses interest rates or liquidity measures.
Nifty 50 Forecast for Next Week (August 11–15, 2025)Based on available data, here’s the forecast for the week:Key Levels to WatchSupport Levels: 23,200, 23,500, (200-DMA). If A weekly candle break and close below 22,000 could accelerate selling toward 22,500.
Resistance Levels: 25,545–25,955. A sustained move above 25,900 could signal a potential reversal, with 26,000 as a critical psychological level.
Trend: Bearish with support at 24,200 critical. A positive global cue (e.g., GIFT Nifty up 0.36% on August 4) could support a modest recovery.
#Technical Outlook
- Bearish Scenario: If the Nifty fails to hold 23,200, it could slide toward 22,900 or lower, aligning with the 200-DMA. The inverse head-and-shoulders pattern on the weekly chart suggests a potential base at 22,900, but confirmation is pending.
- Bullish Scenario: A break above 24,600 could trigger a short-term rally toward 24,925–25,045. Sustaining above 25,000 may push the index toward 25,250, potentially signaling a trend reversal.
Indicators: Oversold RSI (35–40) suggests a possible bounce, but bearish MACD and selling volume indicate caution. Traders should monitor for a bullish crossover in MACD or RSI moving above 50 for confirmation of upward momentum.
Key Factors to WatchGlobal Markets: Movements in major indices like NASDAQ, Dow Jones, and FTSE will influence Nifty’s direction. Positive cues from GIFT Nifty (24,685 on August 4) could support a recovery.
FII/DII Activity: Continued FII selling could pressure the index, while DII buying may limit downside.
RBI Policy: Any dovish signals or liquidity measures could boost sentiment.
Sector Performance: Banking, IT, and energy sectors are critical. Stocks like SBI, Bharti Airtel, and Tata Motors may drive index movements.
Geopolitical and Tariff Issues: US-India trade tensions could cap upside potential.
Monitor volume and global cues for intraday trades.
Long-Term Investors:Current valuations near 23,200–23,400 are attractive for quality stocks. Accumulate fundamentally strong Nifty constituents (e.g., HDFC Bank, Reliance) on dips.
Use oversold conditions as an entry point for long-term portfolios, but diversify to mitigate volatility risks.
Critical PerspectiveWhile the sources provide detailed technical levels and predictions, they rely heavily on historical patterns and short-term indicators, which may not account for sudden macroeconomic shifts or black-swan events. The bearish bias is driven by FII outflows and tariff concerns, but DII support and potential RBI interventions could stabilize the market. Predictions like those from (e.g., Min: 22,200, Max: 26,240) show wide ranges, reflecting uncertainty and volatility. Investors should question overly precise forecasts and focus on broader trends, such as the index’s proximity to the 200-DMA and global market correlations.
ConclusionThe Nifty 50 is likely to remain range-bound between 23,900 and 24,925 next week, with a bearish bias unless it breaks above 24,600. Key supports at 24,200–24,000 and resistance at 24,600–25,045 will dictate short-term movements. Traders should stay cautious, monitor global cues, and prioritise risk management, while long-term investors may find opportunities in oversold conditions. Always verify critical information and consult a financial advisor before making decisions.
Chart for your Reference Only
~~ Disclaimer ~~
This analysis is based on recent technical data and market sentiment from web sources. It is for informational \ educational purposes only and not financial advice. Trading involves high risks, and past performance does not guarantee future results. Always conduct your own research or consult a SEBI-registered advisor before trading.
# Boost and comment will be highly appreciated.
# Current Market Context
Recent Performance: As of August 8, 2025, the Nifty 50 closed at 24,363.30, down 232.85 points (-0.95%), reflecting a bearish sentiment driven by foreign fund outflows and US-India tariff tensions. The index has been trading within a descending channel, characterised by lower highs and lower lows, indicating short-term weakness.
Technical Indicators:
Weekly Chart: A candle formed on the weekly chart, signalling market Bearish. Confirmation of this pattern could indicate further consolidation or a directional move.
Moving Averages: The Nifty is below its 21-day EMA, suggesting bearish momentum. The 5-day SMA and EMA are around 24,843.75 and 24,865.11, respectively, acting as resistance.
RSI and MACD: RSI is in the 35–40 range, indicating oversold conditions, which could signal a potential short-term bounce. MACD remains bearish, reflecting sustained selling pressure.
Pivot Levels: Key resistance is at 25,600–25,925, with immediate support at 23,250–23,400. A break below 23,200 could push the index toward its 200-day DMA (~23,900).
Market Sentiment: Sentiment is cautious due to:FII Outflows: Foreign Institutional Investors (FIIs) sold equities worth ₹4,997.19 crore on August 7, 2025, exerting downward pressure. Domestic Institutional Investors (DIIs) countered with ₹10,864.04 crore in buys, providing some support.
Global Cues: Mixed global market performance (e.g., NASDAQ down 2.24%, Dow Jones up 0.29% on August 4) and US tariff hikes on Indian imports are weighing on sentiment.
RBI Policy: The upcoming RBI policy decision could influence market direction, particularly if it addresses interest rates or liquidity measures.
Nifty 50 Forecast for Next Week (August 11–15, 2025)Based on available data, here’s the forecast for the week:Key Levels to WatchSupport Levels: 23,200, 23,500, (200-DMA). If A weekly candle break and close below 22,000 could accelerate selling toward 22,500.
Resistance Levels: 25,545–25,955. A sustained move above 25,900 could signal a potential reversal, with 26,000 as a critical psychological level.
Trend: Bearish with support at 24,200 critical. A positive global cue (e.g., GIFT Nifty up 0.36% on August 4) could support a modest recovery.
#Technical Outlook
- Bearish Scenario: If the Nifty fails to hold 23,200, it could slide toward 22,900 or lower, aligning with the 200-DMA. The inverse head-and-shoulders pattern on the weekly chart suggests a potential base at 22,900, but confirmation is pending.
- Bullish Scenario: A break above 24,600 could trigger a short-term rally toward 24,925–25,045. Sustaining above 25,000 may push the index toward 25,250, potentially signaling a trend reversal.
Indicators: Oversold RSI (35–40) suggests a possible bounce, but bearish MACD and selling volume indicate caution. Traders should monitor for a bullish crossover in MACD or RSI moving above 50 for confirmation of upward momentum.
Key Factors to WatchGlobal Markets: Movements in major indices like NASDAQ, Dow Jones, and FTSE will influence Nifty’s direction. Positive cues from GIFT Nifty (24,685 on August 4) could support a recovery.
FII/DII Activity: Continued FII selling could pressure the index, while DII buying may limit downside.
RBI Policy: Any dovish signals or liquidity measures could boost sentiment.
Sector Performance: Banking, IT, and energy sectors are critical. Stocks like SBI, Bharti Airtel, and Tata Motors may drive index movements.
Geopolitical and Tariff Issues: US-India trade tensions could cap upside potential.
Monitor volume and global cues for intraday trades.
Long-Term Investors:Current valuations near 23,200–23,400 are attractive for quality stocks. Accumulate fundamentally strong Nifty constituents (e.g., HDFC Bank, Reliance) on dips.
Use oversold conditions as an entry point for long-term portfolios, but diversify to mitigate volatility risks.
Critical PerspectiveWhile the sources provide detailed technical levels and predictions, they rely heavily on historical patterns and short-term indicators, which may not account for sudden macroeconomic shifts or black-swan events. The bearish bias is driven by FII outflows and tariff concerns, but DII support and potential RBI interventions could stabilize the market. Predictions like those from (e.g., Min: 22,200, Max: 26,240) show wide ranges, reflecting uncertainty and volatility. Investors should question overly precise forecasts and focus on broader trends, such as the index’s proximity to the 200-DMA and global market correlations.
ConclusionThe Nifty 50 is likely to remain range-bound between 23,900 and 24,925 next week, with a bearish bias unless it breaks above 24,600. Key supports at 24,200–24,000 and resistance at 24,600–25,045 will dictate short-term movements. Traders should stay cautious, monitor global cues, and prioritise risk management, while long-term investors may find opportunities in oversold conditions. Always verify critical information and consult a financial advisor before making decisions.
Chart for your Reference Only
~~ Disclaimer ~~
This analysis is based on recent technical data and market sentiment from web sources. It is for informational \ educational purposes only and not financial advice. Trading involves high risks, and past performance does not guarantee future results. Always conduct your own research or consult a SEBI-registered advisor before trading.
# Boost and comment will be highly appreciated.
renderwithme
Penerbitan berkaitan
Penafian
Maklumat dan penerbitan adalah tidak dimaksudkan untuk menjadi, dan tidak membentuk, nasihat untuk kewangan, pelaburan, perdagangan dan jenis-jenis lain atau cadangan yang dibekalkan atau disahkan oleh TradingView. Baca dengan lebih lanjut di Terma Penggunaan.