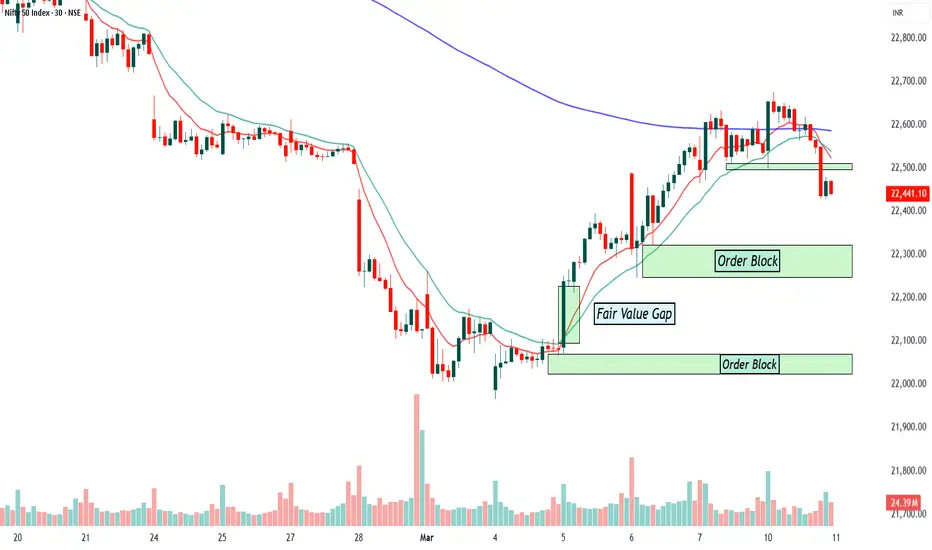
Order Blocks (OB): These are highlighted in green rectangles and represent areas where institutional traders (smart money) previously placed large buy or sell orders. Price often reacts to these areas by reversing or consolidating before continuing in the trend direction.
Fair Value Gap (FVG): Marked in the chart, this represents an imbalance in price action where there was aggressive buying or selling without enough opposing trades. Price tends to fill these gaps before resuming its trend.
Moving Averages & Trend Indications: The red and green lines appear to be moving averages, used to determine the trend. The blue line (possibly a 200 EMA) acts as a dynamic resistance level.
Recent Price Action: Price was in an uptrend but recently broke below the short-term support level around 22,500. A bearish candle with strong volume suggests potential further downside movement.
Forecast Based on SMC:
Bearish Bias in the Short Term: The price has broken below a key support level and is testing an order block. If this level does not hold, the price may continue dropping toward the next order block around 22,300 or even 22,100.
Possible Reaction from Order Blocks: If buyers step in at the 22,300 order block, we could see a bullish reversal. If the 22,300 level fails, price may reach the lower order block at 22,100 before finding strong support.
Liquidity Consideration: If the price sweeps below the 22,300 level, it may be a liquidity grab before reversing upwards. Traders should watch for bullish confirmations (e.g., bullish engulfing candle, higher lows, or support retest).
Trading Strategy:
Bullish Scenario: Look for a bounce at order block zones (22,300 or 22,100) before entering a long trade. Confirmation could come from price action patterns like bullish engulfing candles or a higher low formation.
Bearish Scenario: If price fails to hold above the order block at 22,300, it could drop further to 22,100 or even lower. A break and retest below 22,300 could provide a short entry opportunity.
Final Thoughts:
Short-term bearish, but watch for a reversal at order blocks.
If the price breaks below 22,300, expect a further drop to 22,100.
If bullish momentum returns, price may recover towards 22,500.
This is educational post and not a buy and sell recommendation and always consult your financial advisor before trading or investing.
Penafian
Maklumat dan penerbitan adalah tidak dimaksudkan untuk menjadi, dan tidak membentuk, nasihat untuk kewangan, pelaburan, perdagangan dan jenis-jenis lain atau cadangan yang dibekalkan atau disahkan oleh TradingView. Baca dengan lebih lanjut di Terma Penggunaan.
Penafian
Maklumat dan penerbitan adalah tidak dimaksudkan untuk menjadi, dan tidak membentuk, nasihat untuk kewangan, pelaburan, perdagangan dan jenis-jenis lain atau cadangan yang dibekalkan atau disahkan oleh TradingView. Baca dengan lebih lanjut di Terma Penggunaan.