NIFTY 50 Commentary (As of October 14, 2025)
The NSE Nifty 50 closed at 25,145.50 on October 14, 2025, down 82 points or 0.33% from the previous close. The index opened 25,277.55(ETH), reached a high of 25,310.35, and a low of 25,060.55 during a volatile session marked by broad-based selling. This extended losses from the prior day, with midcaps and smallcaps falling ~1%, driven by global trade tensions and profit-taking ahead of Q2 earnings. Sectoral drags included pharma (down 1-2% on regulatory news) and PSU banks, while IT showed mild resilience.
Technical Analysis
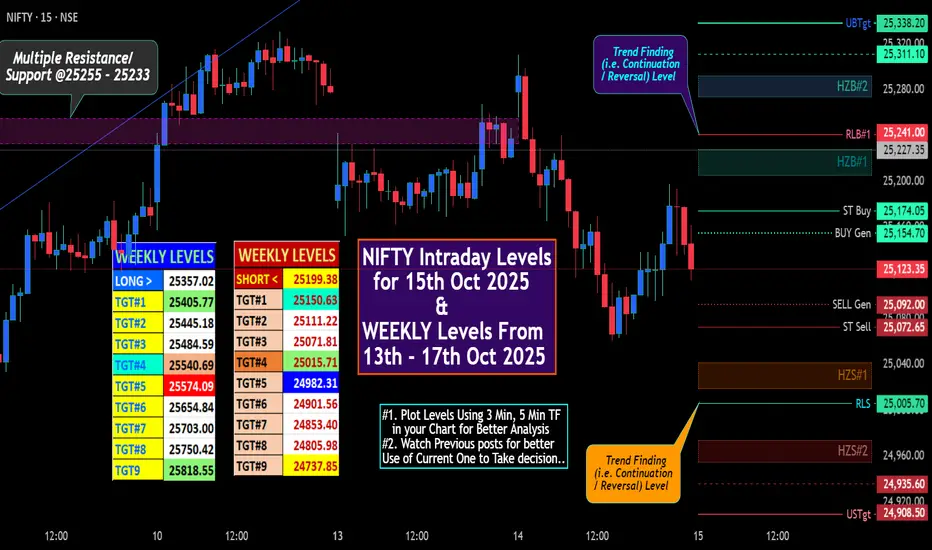
Candlestick Patterns and Indicators: Daily chart formed a bearish candle with lower highs, signaling continuation of pullback. Intraday 15-min showed volatility with a failed upside breakout. RSI (14) at ~48 (nearing oversold), MACD bearish. Support at 25,005-25,040 (key pivot and 200-DMA), resistance at 25,205-25,240 ( Detailed mentioned on Chart).
Implied Volatility: India VIX closed at 11.01, up slightly, indicating rising caution post-expiry.
Option Greeks: Near-ATM strikes (~25,150) have Delta ~0.5/-0.5, Theta ~₹10-15/day, Gamma favoring breaks below support.
# "WEEKLY Levels" mentioned in BOX format.
^^^^^^^Plot Levels Using 3 Min, 5 Min Time frame in your Chart for Better Analysis^^^^^^^
L#1: If the candle crossed & stays above the “Buy Gen”, it is treated / considered as Bullish bias.
L#2: Possibility / Probability of REVERSAL near RLB#1 & UBTgt
L#3: If the candle stays above “Sell Gen” but below “Buy Gen”, it is treated / considered as Sidewise. Aggressive Traders can take Long position near “Sell Gen” either retesting or crossed from Below & vice-versa i.e. can take Short position near “Buy Gen” either retesting or crossed downward from Above.
L#4: If the candle crossed & stays below the “Sell Gen”, it is treated / considered a Bearish bias.
L#5: Possibility / Probability of REVERSAL near RLS#1 & USTgt
HZB (Buy side) & HZS (Sell side) => Hurdle Zone,
*** Specialty of “HZB#1, HZB#2 HZS#1 & HZS#2” is Sidewise (behaviour in Nature)
Rest Plotted and Mentioned on Chart
Color code Used:
Green =. Positive bias.
Red =. Negative bias.
RED in Between Green means Trend Finder / Momentum Change
/ CYCLE Change and Vice Versa.
Notice One thing: HOW LEVELS are Working.
Use any Momentum Indicator / Oscillatoror as you "USED to" to Take entry.
⚠️ DISCLAIMER:
The information, views, and ideas shared here are purely for educational and informational purposes only. They are not intended as investment advice or a recommendation to buy, sell, or hold any financial instruments. I am not a SEBI-registered financial adviser.
Trading and investing in the stock market involves risk, and you should do your own research and analysis. You are solely responsible for any decisions made based on this research.
"As HARD EARNED MONEY IS YOUR's, So DECISION SHOULD HAVE TO BE YOUR's".
Do comment if Helpful.
In depth Analysis will be added later
The NSE Nifty 50 closed at 25,145.50 on October 14, 2025, down 82 points or 0.33% from the previous close. The index opened 25,277.55(ETH), reached a high of 25,310.35, and a low of 25,060.55 during a volatile session marked by broad-based selling. This extended losses from the prior day, with midcaps and smallcaps falling ~1%, driven by global trade tensions and profit-taking ahead of Q2 earnings. Sectoral drags included pharma (down 1-2% on regulatory news) and PSU banks, while IT showed mild resilience.
Technical Analysis
Candlestick Patterns and Indicators: Daily chart formed a bearish candle with lower highs, signaling continuation of pullback. Intraday 15-min showed volatility with a failed upside breakout. RSI (14) at ~48 (nearing oversold), MACD bearish. Support at 25,005-25,040 (key pivot and 200-DMA), resistance at 25,205-25,240 ( Detailed mentioned on Chart).
Implied Volatility: India VIX closed at 11.01, up slightly, indicating rising caution post-expiry.
Option Greeks: Near-ATM strikes (~25,150) have Delta ~0.5/-0.5, Theta ~₹10-15/day, Gamma favoring breaks below support.
# "WEEKLY Levels" mentioned in BOX format.
^^^^^^^Plot Levels Using 3 Min, 5 Min Time frame in your Chart for Better Analysis^^^^^^^
L#1: If the candle crossed & stays above the “Buy Gen”, it is treated / considered as Bullish bias.
L#2: Possibility / Probability of REVERSAL near RLB#1 & UBTgt
L#3: If the candle stays above “Sell Gen” but below “Buy Gen”, it is treated / considered as Sidewise. Aggressive Traders can take Long position near “Sell Gen” either retesting or crossed from Below & vice-versa i.e. can take Short position near “Buy Gen” either retesting or crossed downward from Above.
L#4: If the candle crossed & stays below the “Sell Gen”, it is treated / considered a Bearish bias.
L#5: Possibility / Probability of REVERSAL near RLS#1 & USTgt
HZB (Buy side) & HZS (Sell side) => Hurdle Zone,
*** Specialty of “HZB#1, HZB#2 HZS#1 & HZS#2” is Sidewise (behaviour in Nature)
Rest Plotted and Mentioned on Chart
Color code Used:
Green =. Positive bias.
Red =. Negative bias.
RED in Between Green means Trend Finder / Momentum Change
/ CYCLE Change and Vice Versa.
Notice One thing: HOW LEVELS are Working.
Use any Momentum Indicator / Oscillatoror as you "USED to" to Take entry.
⚠️ DISCLAIMER:
The information, views, and ideas shared here are purely for educational and informational purposes only. They are not intended as investment advice or a recommendation to buy, sell, or hold any financial instruments. I am not a SEBI-registered financial adviser.
Trading and investing in the stock market involves risk, and you should do your own research and analysis. You are solely responsible for any decisions made based on this research.
"As HARD EARNED MONEY IS YOUR's, So DECISION SHOULD HAVE TO BE YOUR's".
Do comment if Helpful.
In depth Analysis will be added later
Penerbitan berkaitan
Penafian
Maklumat dan penerbitan adalah tidak dimaksudkan untuk menjadi, dan tidak membentuk, nasihat untuk kewangan, pelaburan, perdagangan dan jenis-jenis lain atau cadangan yang dibekalkan atau disahkan oleh TradingView. Baca dengan lebih lanjut di Terma Penggunaan.
Penerbitan berkaitan
Penafian
Maklumat dan penerbitan adalah tidak dimaksudkan untuk menjadi, dan tidak membentuk, nasihat untuk kewangan, pelaburan, perdagangan dan jenis-jenis lain atau cadangan yang dibekalkan atau disahkan oleh TradingView. Baca dengan lebih lanjut di Terma Penggunaan.