📊 Current Snapshot
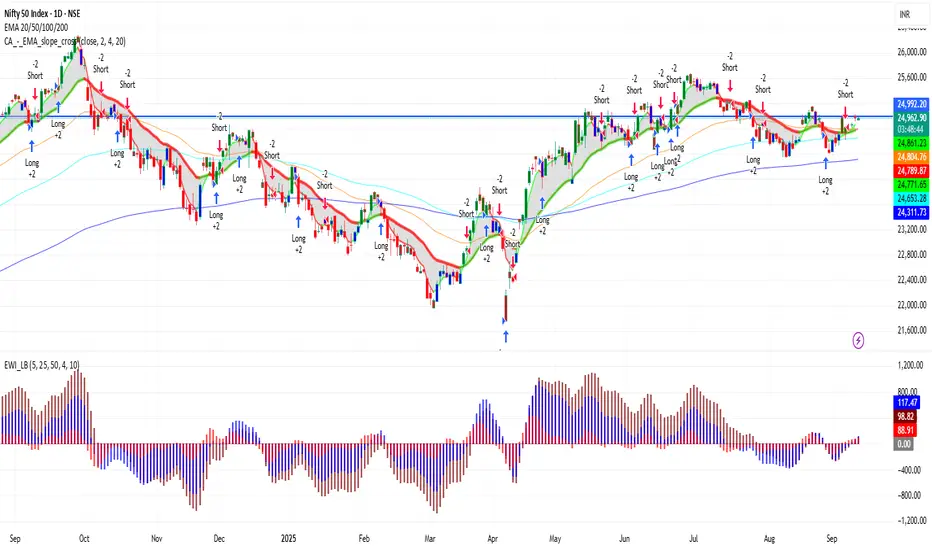
Current Price: ₹24,981
Previous Close: ₹24,960.15
Day’s Range: ₹24,915 – ₹25,035
52-Week Range: ₹21,743 – ₹26,277
Market Cap: Approx. ₹21.5 lakh crore
Volume: ~1.8 crore shares
🔑 Key Support & Resistance Levels
Immediate Support: ₹24,900
Next Support: ₹24,500
Immediate Resistance: ₹25,050
Next Resistance: ₹25,200
📈 Trend & Indicators
Trend: Neutral to mildly bullish; trading near 50-day and 200-day moving averages.
RSI (14): 65 – approaching overbought zone.
MACD: Positive, indicating bullish momentum.
Moving Averages: Short-term moving averages suggest neutral to slightly bullish outlook.
🔮 Outlook
Bullish Scenario: Break above ₹25,050 with strong volume could push Nifty toward ₹25,200.
Bearish Scenario: Drop below ₹24,900 may lead to further decline toward ₹24,500.
Neutral Scenario: Consolidation between ₹24,900 – ₹25,050; breakout needed for directional move.
📌 Key Factors to Watch
Broader market sentiment.
Economic indicators such as interest rates and inflation.
Global cues affecting investor confidence.
Penerbitan berkaitan
Penafian
The information and publications are not meant to be, and do not constitute, financial, investment, trading, or other types of advice or recommendations supplied or endorsed by TradingView. Read more in the Terms of Use.
Penerbitan berkaitan
Penafian
The information and publications are not meant to be, and do not constitute, financial, investment, trading, or other types of advice or recommendations supplied or endorsed by TradingView. Read more in the Terms of Use.