NIFTY 50 Technical View:
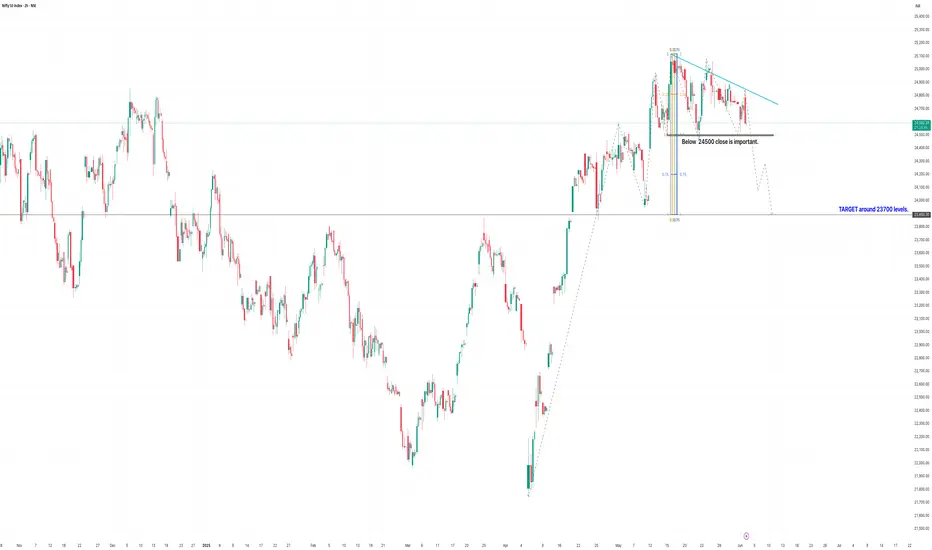
Formation: Symmetrical Triangle Pattern formation is observed.
Key Support Level: 24,500 — A daily close below 24,500 is critical for confirmation of a breakdown.
Downside Target: Post-breakdown, the next target is projected around 23,700 levels.
Resistance Trendline: Descending trendline acting as a strong resistance on the top side.
Market Implication:
Breakdown of the triangle could trigger a sharp downside move.
Below 24,500, sentiment will likely turn bearish leading toward the 23,700 zone.
Quick Highlights:
⚠️ Watch for a daily close below 24,500.
🎯 Target: 23,700 levels.
⛔ Invalidation: Sustained move above the descending trendline would invalidate the bearish view.
Chart Summary:
The lower highs and strong horizontal support setup which typically hints at a bearish breakout from a triangle.
Disclaimer:
This analysis is for educational and informational purposes only and should not be considered as investment advice or a recommendation to buy or sell any financial instrument. Trading and investing involve significant risk, and you should always conduct your own research or consult with a qualified financial advisor before making any trading decisions. Past performance is not indicative of future results. The author will not be held responsible for any losses incurred from the use of this information.
Penafian
Maklumat dan penerbitan adalah tidak dimaksudkan untuk menjadi, dan tidak membentuk, nasihat untuk kewangan, pelaburan, perdagangan dan jenis-jenis lain atau cadangan yang dibekalkan atau disahkan oleh TradingView. Baca dengan lebih lanjut di Terma Penggunaan.
Penafian
Maklumat dan penerbitan adalah tidak dimaksudkan untuk menjadi, dan tidak membentuk, nasihat untuk kewangan, pelaburan, perdagangan dan jenis-jenis lain atau cadangan yang dibekalkan atau disahkan oleh TradingView. Baca dengan lebih lanjut di Terma Penggunaan.