Here’s a breakdown of the **Nifty 50 Index (15-minute chart)**
---
## 🧠 **Intraday Technical Analysis – Nifty 50 (15M TF)**
**Date:** May 28, 2025
**Pattern Observed:** Box Range Breakdown with Measured Move
**Timeframe:** 15-minute chart
---
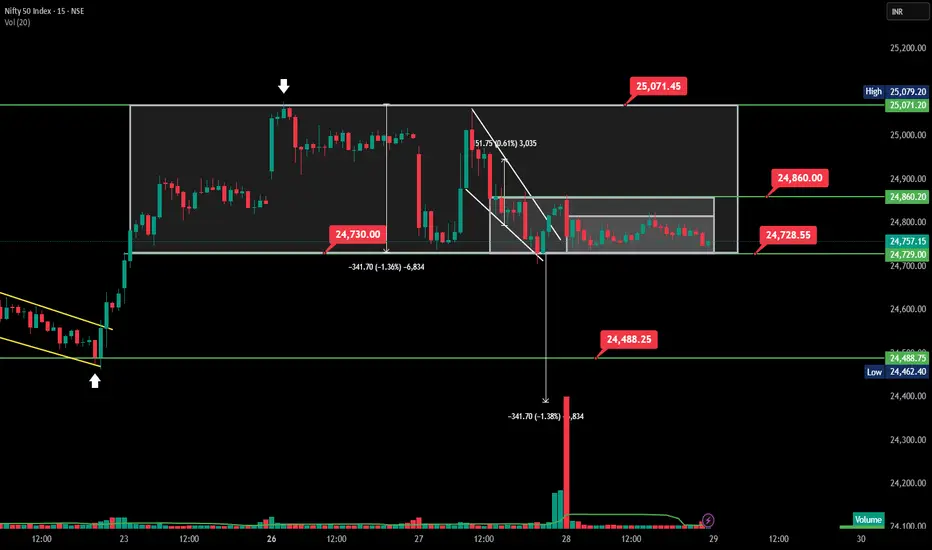
### 🔍 **1. Chart Structure**
* The index **broke out** of a falling wedge pattern but unable move above 24860.
* **Range formation:** A strong horizontal box range formed between **24,730 – 25,071**, holding for multiple sessions.
* **Breakdown:** Price broke the lower boundary at **24,730**, triggering a sell-off of \~342 points (-1.36%) down to **24,488**, which matches the **measured move**.
---
### 📉 **2. Breakdown Move**
* **Breakdown Level:** 24,730
* **Measured Target:** 24,488 (achieved perfectly)
* **Volume Spike:** Major red volume candle confirms institutional selling post-breakdown.
---
### 🔄 **3. Post Breakdown Consolidation**
* After hitting the measured target, the index formed a **mini-consolidation box** between **24,729–24,860**.
* **Price struggling to reclaim 24,860**, indicating weak intraday buying and possible continuation.
---
### 🔁 **4. Key Levels**
| Level Type | Price (₹) |
| -------------------- | --------- |
| Resistance (Box Top) | 25,071 |
| Breakdown Level | 24,730 |
| Mini-Range Top | 24,860 |
| Support/Target Hit | 24,488 |
---
### 📌 **5. Conclusion & Strategy**
* **Bias:** Bearish below 24,729
* **Next move:** If price breaks below **24,729**, a retest of **24,488–24,462** zone is likely.
* **Bullish above 24,860** only if accompanied by volume.
* **Intraday Scalping Zone:** Between 24,729–24,860 (rangebound behavior)
---
Here's a **Nifty 50 Open Interest (OI) analysis** based on the charts you've provided (as of May 28, 2025):
---
### 📊 **1. Open Interest Data Interpretation**
* **Spot Price**: 24,757.15
* **Max Pain**: 24,800
* **Put-Call Ratio (PCR)**:
* **Current PCR**: 0.888 → Slightly bearish to neutral
* **PCR (All)**: 0.6626 → Bearish sentiment
#### 🔹 Key OI Levels:
* **Highest Call OI**:
* **25,000 CE** with \~1.2 Cr contracts
* Suggests **strong resistance** at 25,000 and 24,800
* **Highest Put OI**:
* **24,500 PE** with \~78L contracts
* Suggests **strong support** at 24,500
---
### 📈 **2. Change in OI (Intraday Insight)**
* **Strong addition in Call OI** at:
* **24,800 CE**
* **24,750 CE**
* Indicates fresh short positions in calls → Bears active here
* **Put OI change**: Mixed with some unwinding around 24,900–25,000
* **Short Put unwinding** near higher levels = Reduced bullish conviction
---
### 🔍 **3. Technical Chart (15-Minute View)**
* **Price action** shows a breakdown from a range between **24,730–25,070**
* Breakdown target met at **24,488**, now consolidating in a small range
* Heavy volume seen on the breakdown → confirms strength of sellers
---
### 📌 **4. Conclusion**
| Factor | Interpretation |
| ------------------- | --------------------------- |
| PCR | Bearish (below 1) |
| Max Pain | 24,800 (neutral zone) |
| Resistance | 25,000 |
| Support | 24,500 |
| Chart Price Action | Bearish breakdown confirmed |
| Volume on Breakdown | Very high |
---
### 📣 **Strategy Insight**
* **Intraday bias**: Bearish below 24,750
* **Upside capped** at 24,860–25,000 unless short covering occurs
* **Downside support**: 24,500; break below may lead to **24,400–24,300**
---
## 🧠 **Intraday Technical Analysis – Nifty 50 (15M TF)**
**Date:** May 28, 2025
**Pattern Observed:** Box Range Breakdown with Measured Move
**Timeframe:** 15-minute chart
---
### 🔍 **1. Chart Structure**
* The index **broke out** of a falling wedge pattern but unable move above 24860.
* **Range formation:** A strong horizontal box range formed between **24,730 – 25,071**, holding for multiple sessions.
* **Breakdown:** Price broke the lower boundary at **24,730**, triggering a sell-off of \~342 points (-1.36%) down to **24,488**, which matches the **measured move**.
---
### 📉 **2. Breakdown Move**
* **Breakdown Level:** 24,730
* **Measured Target:** 24,488 (achieved perfectly)
* **Volume Spike:** Major red volume candle confirms institutional selling post-breakdown.
---
### 🔄 **3. Post Breakdown Consolidation**
* After hitting the measured target, the index formed a **mini-consolidation box** between **24,729–24,860**.
* **Price struggling to reclaim 24,860**, indicating weak intraday buying and possible continuation.
---
### 🔁 **4. Key Levels**
| Level Type | Price (₹) |
| -------------------- | --------- |
| Resistance (Box Top) | 25,071 |
| Breakdown Level | 24,730 |
| Mini-Range Top | 24,860 |
| Support/Target Hit | 24,488 |
---
### 📌 **5. Conclusion & Strategy**
* **Bias:** Bearish below 24,729
* **Next move:** If price breaks below **24,729**, a retest of **24,488–24,462** zone is likely.
* **Bullish above 24,860** only if accompanied by volume.
* **Intraday Scalping Zone:** Between 24,729–24,860 (rangebound behavior)
---
Here's a **Nifty 50 Open Interest (OI) analysis** based on the charts you've provided (as of May 28, 2025):
---
### 📊 **1. Open Interest Data Interpretation**
* **Spot Price**: 24,757.15
* **Max Pain**: 24,800
* **Put-Call Ratio (PCR)**:
* **Current PCR**: 0.888 → Slightly bearish to neutral
* **PCR (All)**: 0.6626 → Bearish sentiment
#### 🔹 Key OI Levels:
* **Highest Call OI**:
* **25,000 CE** with \~1.2 Cr contracts
* Suggests **strong resistance** at 25,000 and 24,800
* **Highest Put OI**:
* **24,500 PE** with \~78L contracts
* Suggests **strong support** at 24,500
---
### 📈 **2. Change in OI (Intraday Insight)**
* **Strong addition in Call OI** at:
* **24,800 CE**
* **24,750 CE**
* Indicates fresh short positions in calls → Bears active here
* **Put OI change**: Mixed with some unwinding around 24,900–25,000
* **Short Put unwinding** near higher levels = Reduced bullish conviction
---
### 🔍 **3. Technical Chart (15-Minute View)**
* **Price action** shows a breakdown from a range between **24,730–25,070**
* Breakdown target met at **24,488**, now consolidating in a small range
* Heavy volume seen on the breakdown → confirms strength of sellers
---
### 📌 **4. Conclusion**
| Factor | Interpretation |
| ------------------- | --------------------------- |
| PCR | Bearish (below 1) |
| Max Pain | 24,800 (neutral zone) |
| Resistance | 25,000 |
| Support | 24,500 |
| Chart Price Action | Bearish breakdown confirmed |
| Volume on Breakdown | Very high |
---
### 📣 **Strategy Insight**
* **Intraday bias**: Bearish below 24,750
* **Upside capped** at 24,860–25,000 unless short covering occurs
* **Downside support**: 24,500; break below may lead to **24,400–24,300**
Penafian
Maklumat dan penerbitan adalah tidak dimaksudkan untuk menjadi, dan tidak membentuk, nasihat untuk kewangan, pelaburan, perdagangan dan jenis-jenis lain atau cadangan yang dibekalkan atau disahkan oleh TradingView. Baca dengan lebih lanjut di Terma Penggunaan.
Penafian
Maklumat dan penerbitan adalah tidak dimaksudkan untuk menjadi, dan tidak membentuk, nasihat untuk kewangan, pelaburan, perdagangan dan jenis-jenis lain atau cadangan yang dibekalkan atau disahkan oleh TradingView. Baca dengan lebih lanjut di Terma Penggunaan.