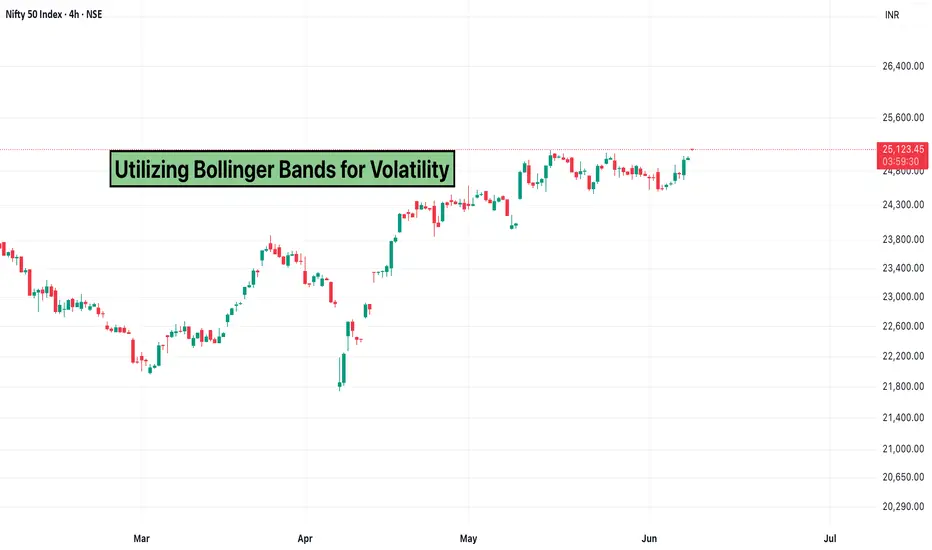
Bollinger Bands are one of the most popular tools used by traders to assess market volatility and potential price action.
Created by John Bollinger, this indicator consists of a middle band (a simple moving average) and two outer bands that represent standard deviations away from the average. When markets get quiet or volatile, Bollinger Bands visually show the expansion or contraction, helping traders adapt their strategy in real-time.
What Are Bollinger Bands?
These bands adjust dynamically based on market conditions, making them ideal for tracking price volatility.
Why Use Bollinger Bands?
Common Trading Uses
How to Apply on TradingView
Conclusion
Bollinger Bands are versatile and work across all timeframes and asset types. They’re especially useful for spotting volatility shifts, timing breakouts, and identifying mean-reverting opportunities.
Like any indicator, they work best when combined with broader analysis, not used in isolation.
Created by John Bollinger, this indicator consists of a middle band (a simple moving average) and two outer bands that represent standard deviations away from the average. When markets get quiet or volatile, Bollinger Bands visually show the expansion or contraction, helping traders adapt their strategy in real-time.
What Are Bollinger Bands?
- Middle Band: Typically a 20-day simple moving average (SMA).
- Upper Band: Two standard deviations above the SMA.
- Lower Band: Two standard deviations below the SMA.
These bands adjust dynamically based on market conditions, making them ideal for tracking price volatility.
Why Use Bollinger Bands?
- Volatility Indicator: Bands widen during high volatility and contract when the market is quiet.
- Price Targets: Prices tend to return to the mean (middle band), which can act as a support or resistance level.
- Breakout Signals: A sudden expansion in bands often signals a strong move in either direction.
Common Trading Uses
- Bollinger Bounce: When the price touches the lower or upper band and reverts toward the middle band.
- Bollinger Squeeze: A narrowing of the bands that signals an upcoming breakout. Traders prepare for strong movement in either direction.
How to Apply on TradingView
- Search for Bollinger Bands in the indicator list.
- Apply it with default settings or tweak the period and standard deviation based on your strategy.
- Combine with volume, RSI, or candlestick patterns for better trade confirmation.
Conclusion
Bollinger Bands are versatile and work across all timeframes and asset types. They’re especially useful for spotting volatility shifts, timing breakouts, and identifying mean-reverting opportunities.
Like any indicator, they work best when combined with broader analysis, not used in isolation.
Elevate your Trading Experience 🚀
📱 Download Dhan App on iOS and Android and Start Trading.
📱 Download Dhan App on iOS and Android and Start Trading.
Penafian
Maklumat dan penerbitan adalah tidak dimaksudkan untuk menjadi, dan tidak membentuk, nasihat untuk kewangan, pelaburan, perdagangan dan jenis-jenis lain atau cadangan yang dibekalkan atau disahkan oleh TradingView. Baca dengan lebih lanjut di Terma Penggunaan.
