In modern trading, price action alone isn’t enough. What separates professional and institutional traders from the rest is how they interpret where price closes — not just where it goes.
This concept is captured in what we call the True Close Theory — the belief that:
"The candle’s close reveals the market’s true intent — not the wick, not the high, and not the drama."
Here’s a live market example to show how you can apply True Close Theory using 1-hour closes, with confirmation and entries from 15-minute or 5-minute charts.
📊 Chart Breakdown
Let’s break this down:
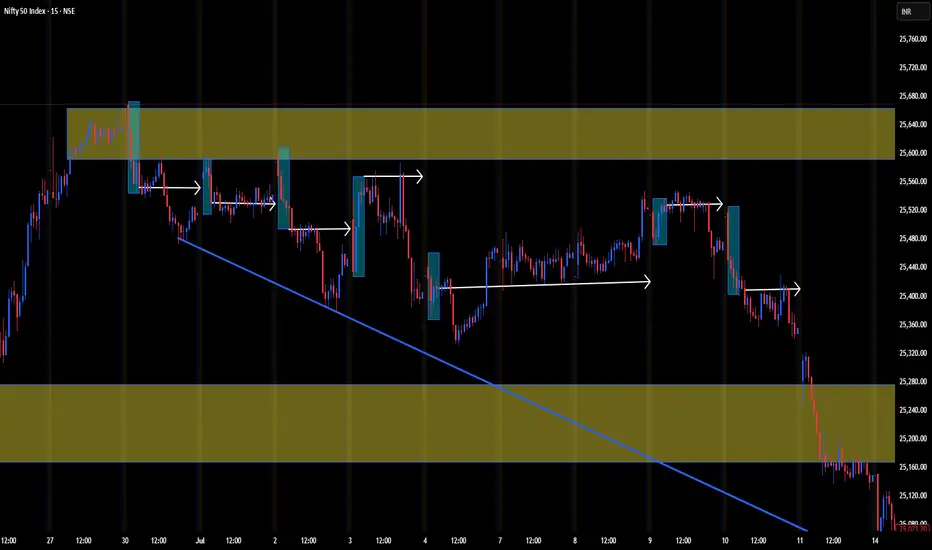
🟨 Yellow Zones: Manually marked support and resistance zones, drawn based on past price reactions, where institutional activity is likely.
➡️ White Arrows: Represent the 1-Hour True Close for the Day — highlighting how price reacted around those institutional zones on a daily basis.
🔵 Blue Downtrend Line: Visual structure of lower highs confirming a bearish environment until a new character shift happens.
🧠 The Power of 1-Hour True Close
Instead of chasing moves or relying on breakout wicks, the True Close method waits for:
The daily close of the 1-hour candle.
A close above or below an important level or zone.
If it fails to close above resistance or below support, it signals institutional rejection.
This daily closing behavior often sets the tone for the next session.
🧷 Real Market Behavior from the Chart
🔽 Shorts from Supply Rejection
Price enters the upper yellow resistance zone.
Each day, the 1-hour close fails to stay above — shown by white arrows closing back inside or below.
This indicates strong institutional selling, not a breakout.
👉 Lower timeframe entry (15m/5m): Once the daily close rejects, traders drop to the lower TFs to find pullback entries with:
VWAP/EMA rejection
Reversal patterns
Liquidity sweep fake-outs
📉 Consolidation to Breakdown
Mid-chart shows several days of tight range inside a minor structure.
Despite upward attempts, the true closes show no bullish follow-through — just sideways absorption.
Eventually, price breaks down from support with a daily 1-hour close outside the yellow box.
👉 Again, entries can be managed on LTF pullbacks to the breakdown zone.
🔽 Final Leg to Demand
Price sells off sharply toward the bottom yellow support zone.
Even after a minor bounce, the daily close doesn’t show strength — again highlighted by weak closes with no bullish engulfing or structure reclaim.
🔁 How to Use This in Your Trading
✅ Strategy Flow:
Mark Institutional Zones (support/resistance from HTF like 1H/4H).
Wait for 1-Hour Daily Close (ideally around session end like NY close).
Check if the candle:
Rejected the zone (closed inside)
Broke clean (closed above/below with body)
Drop to 15m or 5m chart the next day/session:
Look for re-tests, patterns, structure shifts.
Enter with tight stops, targeting the next zone.
🔚 Final Thoughts
This chart is a live example of how True Close Theory combined with institutional S/R zones gives you a powerful advantage:
You’re not guessing.
You’re not chasing wicks.
You’re aligning with how smart money actually operates — by watching the close and letting the market reveal its bias.
Happy Trading !!!..
This concept is captured in what we call the True Close Theory — the belief that:
"The candle’s close reveals the market’s true intent — not the wick, not the high, and not the drama."
Here’s a live market example to show how you can apply True Close Theory using 1-hour closes, with confirmation and entries from 15-minute or 5-minute charts.
📊 Chart Breakdown
Let’s break this down:
🟨 Yellow Zones: Manually marked support and resistance zones, drawn based on past price reactions, where institutional activity is likely.
➡️ White Arrows: Represent the 1-Hour True Close for the Day — highlighting how price reacted around those institutional zones on a daily basis.
🔵 Blue Downtrend Line: Visual structure of lower highs confirming a bearish environment until a new character shift happens.
🧠 The Power of 1-Hour True Close
Instead of chasing moves or relying on breakout wicks, the True Close method waits for:
The daily close of the 1-hour candle.
A close above or below an important level or zone.
If it fails to close above resistance or below support, it signals institutional rejection.
This daily closing behavior often sets the tone for the next session.
🧷 Real Market Behavior from the Chart
🔽 Shorts from Supply Rejection
Price enters the upper yellow resistance zone.
Each day, the 1-hour close fails to stay above — shown by white arrows closing back inside or below.
This indicates strong institutional selling, not a breakout.
👉 Lower timeframe entry (15m/5m): Once the daily close rejects, traders drop to the lower TFs to find pullback entries with:
VWAP/EMA rejection
Reversal patterns
Liquidity sweep fake-outs
📉 Consolidation to Breakdown
Mid-chart shows several days of tight range inside a minor structure.
Despite upward attempts, the true closes show no bullish follow-through — just sideways absorption.
Eventually, price breaks down from support with a daily 1-hour close outside the yellow box.
👉 Again, entries can be managed on LTF pullbacks to the breakdown zone.
🔽 Final Leg to Demand
Price sells off sharply toward the bottom yellow support zone.
Even after a minor bounce, the daily close doesn’t show strength — again highlighted by weak closes with no bullish engulfing or structure reclaim.
🔁 How to Use This in Your Trading
✅ Strategy Flow:
Mark Institutional Zones (support/resistance from HTF like 1H/4H).
Wait for 1-Hour Daily Close (ideally around session end like NY close).
Check if the candle:
Rejected the zone (closed inside)
Broke clean (closed above/below with body)
Drop to 15m or 5m chart the next day/session:
Look for re-tests, patterns, structure shifts.
Enter with tight stops, targeting the next zone.
🔚 Final Thoughts
This chart is a live example of how True Close Theory combined with institutional S/R zones gives you a powerful advantage:
You’re not guessing.
You’re not chasing wicks.
You’re aligning with how smart money actually operates — by watching the close and letting the market reveal its bias.
Happy Trading !!!..
Nota
Example with 5 mins chart of 30 th June 2025.Nota
Example with 5 mins chart of 1 st July .Nota
Example of 2nd July 5 mins chart. Nota
Backtest and let me know with comments you will be amazed with results .Above 15 mins chart with publication has 7 days of proof with truce close trading concept.Nota
Works on all markets ,stocks, indices i have back tested with older charts give a try let me know with comments if you find this interesting.Nota
4th July Chart with 5 mins time frame Nota
3rd July not 4th july chart above typo Nota
20th July Ethereum Example Nota
22nd Chart of Bitcoin Example.Nota
BTC Long based on true close theory.Nota
Almost achieved expected target.Nota
Today entry long with True close theoryNota
Both 2 days long entry target achieved.Nota
July 29th Chart with True close theory long entry Nota
Target Achieved Penafian
Maklumat dan penerbitan adalah tidak dimaksudkan untuk menjadi, dan tidak membentuk, nasihat untuk kewangan, pelaburan, perdagangan dan jenis-jenis lain atau cadangan yang dibekalkan atau disahkan oleh TradingView. Baca dengan lebih lanjut di Terma Penggunaan.
Penafian
Maklumat dan penerbitan adalah tidak dimaksudkan untuk menjadi, dan tidak membentuk, nasihat untuk kewangan, pelaburan, perdagangan dan jenis-jenis lain atau cadangan yang dibekalkan atau disahkan oleh TradingView. Baca dengan lebih lanjut di Terma Penggunaan.