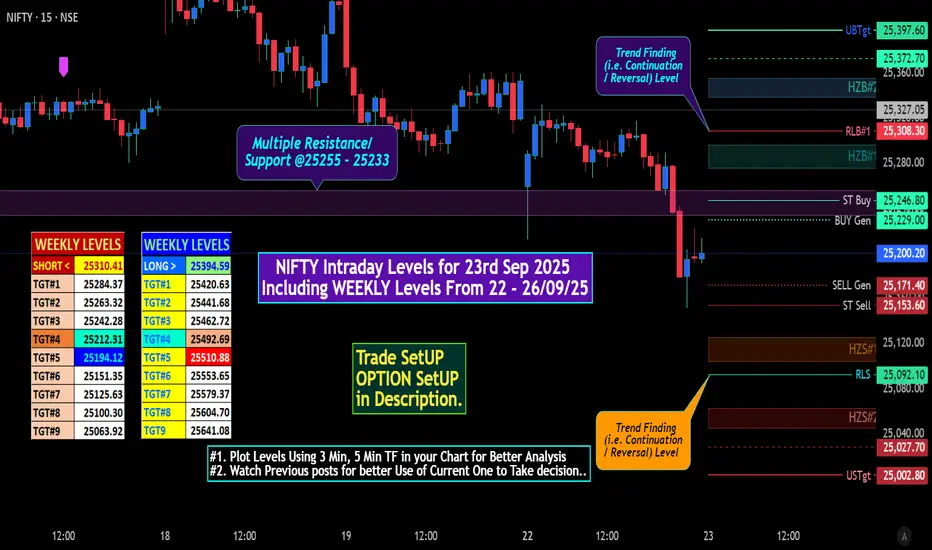
NIFTY Intraday Levels for 23rd Sep 2025
Key Takeaways:
• Immediate Action: Watch the 25,154 - 25,308 range. The breakout/breakdown from this band will dictate the next immediate move.
• Warning Sign: The lower high at ~25,331.7 is the most significant technical red flag for the short-term bullish trend.
• Critical Level: 25,028 is the line in the sand for bulls. Holding it is crucial to maintain the positive structure.
Market View
Intraday View (For the next session)
• View: Neutral / Range-bound. BIAS: Cautious / Neutral to Bearish.
• Scenario 1 (Bullish): A sustained move above 25,245- 25255 could trigger a short-covering rally towards 25,400.372. (In between some levels plotted in Chart)
• Scenario 2 (Bearish): Break below the key support of 25,172 - 25154 could lead to a decline towards the strong support zone of 25,092-25,027.
• Strategy: Trade the range (buy near 25,092 support, sell near 25,305 resistance) with strict stop-losses. Wait for a breakout from this range for a directional move.
Iron Butterfly (Most Suitable for Expiry)
• Sell ATM: 25,200 CE & 25,200 PE
• Buy OTM: 25,250 CE & 25,150 PE
• Max Profit: Premium received (works best if Nifty expires between 25,170-25,230)
• Ideal for: Low volatility, range-bound expiry day
* All levels mentioned on NIFTY spot Basis.
** Try to publish NIFTY Future with More OPTION Strategy.
# "WEEKLY Levels" mentioned in BOX format.
^^^^^^^Plot Levels Using 3 Min, 5 Min Time frame in your Chart for Better Analysis^^^^^^^
L#1: If the candle crossed & stays above the “Buy Gen”, it is treated / considered as Bullish bias.
L#2: Possibility / Probability of REVERSAL near RLB#1 & UBTgt
L#3: If the candle stays above “Sell Gen” but below “Buy Gen”, it is treated / considered as Sidewise. Aggressive Traders can take Long position near “Sell Gen” either retesting or crossed from Below & vice-versa i.e. can take Short position near “Buy Gen” either retesting or crossed downward from Above.
L#4: If the candle crossed & stays below the “Sell Gen”, it is treated / considered a Bearish bias.
L#5: Possibility / Probability of REVERSAL near RLS#1 & USTgt
HZB (Buy side) & HZS (Sell side) => Hurdle Zone,
*** Specialty of “HZB#1, HZB#2 HZS#1 & HZS#2” is Sidewise (behaviour in Nature)
Rest Plotted and Mentioned on Chart
Color code Used:
Green =. Positive bias.
Red =. Negative bias.
RED in Between Green means Trend Finder / Momentum Change
/ CYCLE Change and Vice Versa.
Notice One thing: HOW LEVELS are Working.
Use any Momentum Indicator / Oscillatoror as you "USED to" to Take entry.
📢 Disclaimer
I am not a SEBI-registered financial adviser.
The information, views, and ideas shared here are purely for educational and informational purposes only. They are not intended as investment advice or a recommendation to buy, sell, or hold any financial instruments.
Trading and investing in the stock market involves risk, and you should do your own research and analysis. You are solely responsible for any decisions made based on this research.
"As HARD EARNED MONEY IS YOUR's, So DECISION SHOULD HAVE TO BE YOUR's".
Do Comment if helpful
Nota
NIGTY Spot @ 25119 BULLISH Divergence Seen ion 5 Min TF Chart.Nota
Correction: NIGTY Spot @ 25119 RSI BULLISH Divergence Seen ion 5 Min TF Chart. Nota
NIGTY Spot @ 25220 Impact of "RSI BULLISH Divergence" mentioned earlier.Nota
NIGTY Spot @ 25233 RSI BEARISH Divergence Seen ion 5 Min TF Chart. (Identified 10 min Back.)Penerbitan berkaitan
Penafian
Maklumat dan penerbitan adalah tidak dimaksudkan untuk menjadi, dan tidak membentuk, nasihat untuk kewangan, pelaburan, perdagangan dan jenis-jenis lain atau cadangan yang dibekalkan atau disahkan oleh TradingView. Baca dengan lebih lanjut di Terma Penggunaan.
Penerbitan berkaitan
Penafian
Maklumat dan penerbitan adalah tidak dimaksudkan untuk menjadi, dan tidak membentuk, nasihat untuk kewangan, pelaburan, perdagangan dan jenis-jenis lain atau cadangan yang dibekalkan atau disahkan oleh TradingView. Baca dengan lebih lanjut di Terma Penggunaan.