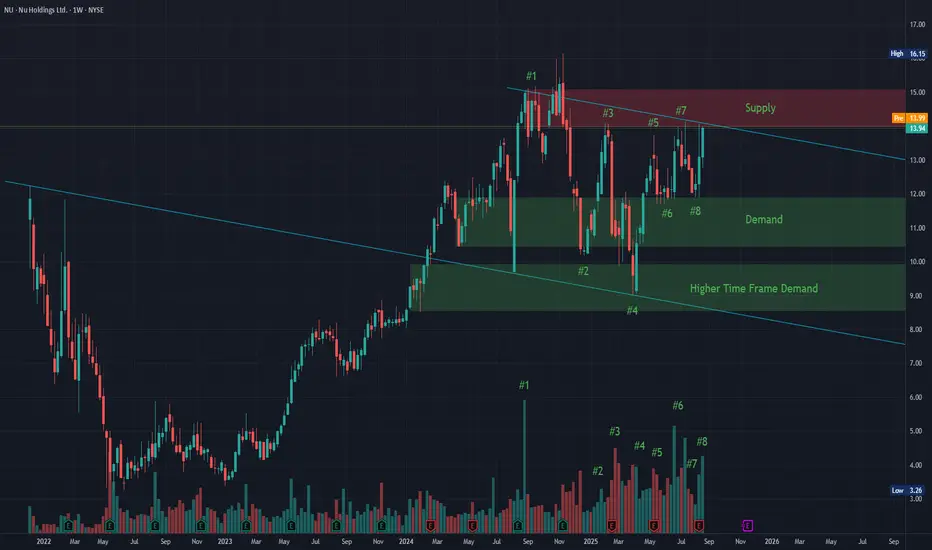
This is the most basic chart I will ever draw to indicate how simple the all-important concept of supply and demand could be.
Let's begin with the initial move to all time highs that we saw in September 2024.
#1.
Strong bullish volume followed by relatively strong bearish volume.
#2.
We re-entered our recent demand zone and quickly moved to our recently created supply zone - but, with weak volume
#3.
We rejected our supply zone with strong volume leading us to needing a deeper pullback into even higher time frame demand
#4.
We utilized this higher time frame liquidity (buyers) to propel us out of the mid demand zone and right back to our supply zone
#5.
We rejected our supply zone again but this time with a less strong reaction and low volume.
#6.
Demand strengthened at our mid demand zone (indicating buyers are stepping up at higher levels). There was no need to go back to our higher time frame demand - buyers were present and indicating that fair value was higher than previously.
#7.
We retested our supply zone and although we saw a rejection, we can see that the volume was weakened and sellers were starting to fizzle out.
#8.
From our mid demand zone, we see volume spike - indicating again that buyers are extremely present but at a higher agreed-upon price.
We are now in the process of breaking through this now-weakened supply zone in order to turn all these former sellers into buyers. What was previously strong resistance will instinctively turn into strong support once the agreed-upon fair-value-price turns from $13 into $15. From there we can start to create a new base of supply and demand in the previously tapped $17-$20 range.
Happy Trading all :)
Trade the Story
Penafian
Maklumat dan penerbitan adalah tidak bertujuan, dan tidak membentuk, nasihat atau cadangan kewangan, pelaburan, dagangan atau jenis lain yang diberikan atau disahkan oleh TradingView. Baca lebih dalam Terma Penggunaan.
Trade the Story
Penafian
Maklumat dan penerbitan adalah tidak bertujuan, dan tidak membentuk, nasihat atau cadangan kewangan, pelaburan, dagangan atau jenis lain yang diberikan atau disahkan oleh TradingView. Baca lebih dalam Terma Penggunaan.