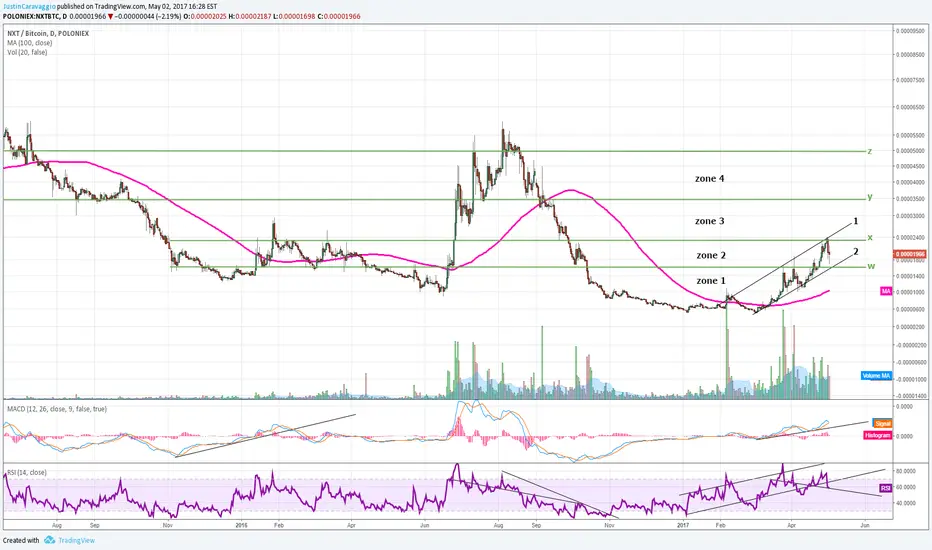
NXT short term sell off but still in a bullish channel

NXT broke out of zone 1 and met resistance at long term support line x (green).
Diagonal trendline 2 and long term support line w provide current support.
If we continue through line x, diagonal line 1 will provide resistance in zone 3.
If RSI breaks above the upper trend line, we might see the price enter into zone 3, other wise, if we ride the lower trend line downward we are likely to see NXT move sideways in zone 2 until falling down to zone 1.
Lets watch bitcoin closely.
Penafian
Maklumat dan penerbitan adalah tidak dimaksudkan untuk menjadi, dan tidak membentuk, nasihat untuk kewangan, pelaburan, perdagangan dan jenis-jenis lain atau cadangan yang dibekalkan atau disahkan oleh TradingView. Baca dengan lebih lanjut di Terma Penggunaan.
Penafian
Maklumat dan penerbitan adalah tidak dimaksudkan untuk menjadi, dan tidak membentuk, nasihat untuk kewangan, pelaburan, perdagangan dan jenis-jenis lain atau cadangan yang dibekalkan atau disahkan oleh TradingView. Baca dengan lebih lanjut di Terma Penggunaan.