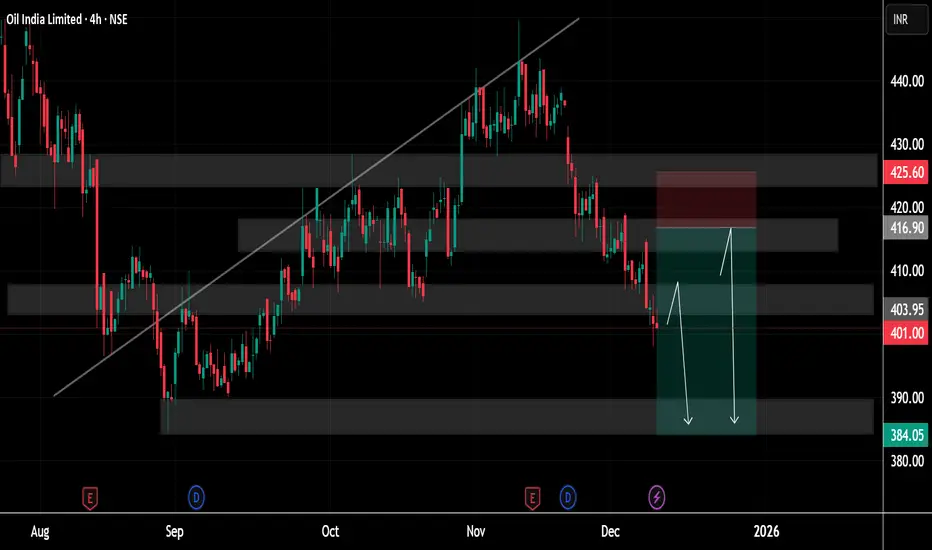
Crude Oil highlighting how the market has shifted from a previously rising trend into a phase of weakness. Earlier, the price followed an upward sloping trendline, reflecting steady buying strength, but eventually the price broke below that trendline, signalling the start of a broader correction. Since then, the chart has formed a series of lower highs and lower lows, showing the transition from bullish momentum to a more bearish structure.
Several supply and demand zones are clearly marked on the chart with shaded regions. These zones help identify where buying or selling pressure is strongest. The upper zone near 425–430 represents a major supply area where sellers have previously stepped in and pushed the price down multiple times. Just below it, the 416–420 region shows another resistance area that reinforces the overhead selling pressure.
On the downside, the price is currently trading around the 401 level, where it is testing a mid-level demand zone. The chart shows projected arrows indicating the possibility of the price dipping deeper into the broader demand area around 384–390. This zone has historically acted as a strong support, where buyers could attempt to defend the price again.
The highlighted risk-to-reward box suggests a potential short setup, where traders might expect further downside movement until the price reaches the lower support zone. However, there is also a secondary upward arrow indicating that if the price finds strong support, it may bounce back toward the mid-range resistance near 416, before facing sellers again.
Overall, the chart represents a long-term picture of price correction inside a well-defined supply and demand structure, where the market is currently showing bearish momentum but may find stability and buyers closer to the lower demand zones. The structure reflects how the market is balancing between downward pressure and potential reversal zones, giving a clear roadmap of key levels for future movement.
If you find it helpful please like and comments for this post and share thanks.
Dagangan aktif
✅FREE FOREX Signals in Telegram
t.me/thedollarpipskiller
✅ Suggest News Channel
t.me/addlist/5h3Y2WG2eyVkOTY0
t.me/thedollarpipskiller
✅ Suggest News Channel
t.me/addlist/5h3Y2WG2eyVkOTY0
Penerbitan berkaitan
Penafian
Maklumat dan penerbitan adalah tidak bertujuan, dan tidak membentuk, nasihat atau cadangan kewangan, pelaburan, dagangan atau jenis lain yang diberikan atau disahkan oleh TradingView. Baca lebih dalam Terma Penggunaan.