Oracle (ORCL) – 4 Bullish Signals Building Up
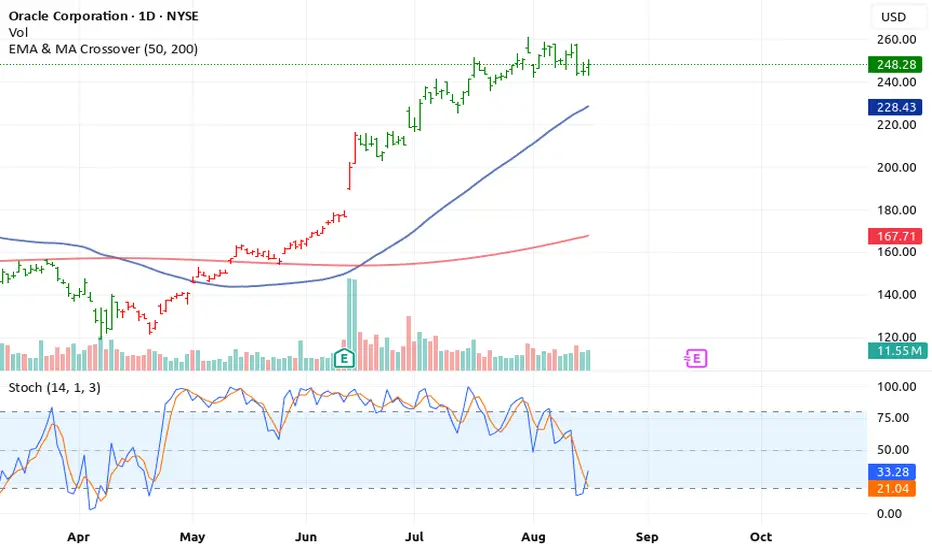
Technical indicators are showing that ORCL may be gearing up for a strong upward move. Multiple timeframes confirm buyers are in control. Here’s the breakdown:
1. Positive Volume Support
Recent sessions show increasing volume on upward moves, indicating that buyers are actively driving the price higher. Strong
volume confirms that the rally is supported and not a weak, unsustainable move.
2. Balance of Power (BOP) Turns Bullish
The Balance of Power (BOP) indicator has shifted into positive territory, showing that buyers have the upper hand. A bullish BOP
suggests strength and momentum in the hands of bulls, aligning with the volume trend.
3. EMA Crossover Confirms Uptrend
The short-term EMA (50 EMA) has crossed above the long-term EMA (200 EMA), a classic bullish signal. EMA crossovers often indicate a trend reversal or continuation of upward momentum.
4. Stochastic Oscillator Supports Bullish Momentum
The Stochastic oscillator shows oversold conditions that are reversing upward and is in alignment with price action. No bearish
divergence is present, confirming that the bullish momentum is healthy and sustainable.
⚡ Conclusion
All key indicators — positive volume, bullish BOP, EMA cross up, and Stochastic support — are pointing to a potential rally in
ORCL ORCL . Traders may consider long positions, scaling in on pullbacks, or holding for trend continuation while managing risk.
Rocket boost this content to learn more
Disclaimer: This is technical analysis only and not financial advice. Always use a simulation
trading account before trading with real money, and take the time to learn risk management and profit-taking strategies to protect your capital.
Technical indicators are showing that ORCL may be gearing up for a strong upward move. Multiple timeframes confirm buyers are in control. Here’s the breakdown:
1. Positive Volume Support
Recent sessions show increasing volume on upward moves, indicating that buyers are actively driving the price higher. Strong
volume confirms that the rally is supported and not a weak, unsustainable move.
2. Balance of Power (BOP) Turns Bullish
The Balance of Power (BOP) indicator has shifted into positive territory, showing that buyers have the upper hand. A bullish BOP
suggests strength and momentum in the hands of bulls, aligning with the volume trend.
3. EMA Crossover Confirms Uptrend
The short-term EMA (50 EMA) has crossed above the long-term EMA (200 EMA), a classic bullish signal. EMA crossovers often indicate a trend reversal or continuation of upward momentum.
4. Stochastic Oscillator Supports Bullish Momentum
The Stochastic oscillator shows oversold conditions that are reversing upward and is in alignment with price action. No bearish
divergence is present, confirming that the bullish momentum is healthy and sustainable.
⚡ Conclusion
All key indicators — positive volume, bullish BOP, EMA cross up, and Stochastic support — are pointing to a potential rally in
ORCL
Rocket boost this content to learn more
Disclaimer: This is technical analysis only and not financial advice. Always use a simulation
trading account before trading with real money, and take the time to learn risk management and profit-taking strategies to protect your capital.
Penerbitan berkaitan
Penafian
Maklumat dan penerbitan adalah tidak bertujuan, dan tidak membentuk, nasihat atau cadangan kewangan, pelaburan, dagangan atau jenis lain yang diberikan atau disahkan oleh TradingView. Baca lebih dalam Terma Penggunaan.
Penerbitan berkaitan
Penafian
Maklumat dan penerbitan adalah tidak bertujuan, dan tidak membentuk, nasihat atau cadangan kewangan, pelaburan, dagangan atau jenis lain yang diberikan atau disahkan oleh TradingView. Baca lebih dalam Terma Penggunaan.
