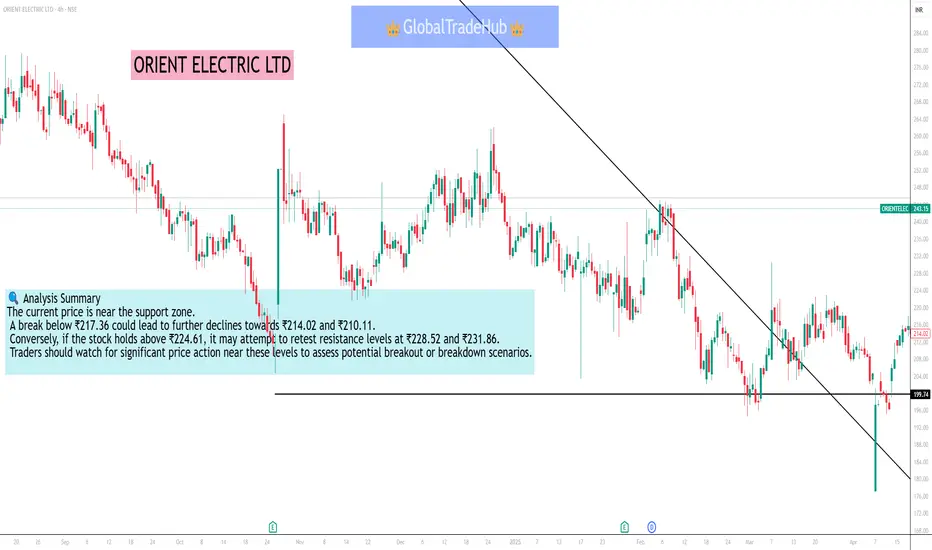
Orient Electric Ltd :-
🔹 Support Levels
S1: ₹217.36
S2: ₹214.02
S3: ₹210.11
🔹 Resistance Levels
R1: ₹224.61
R2: ₹228.52
R3: ₹231.86
These levels are derived from pivot point calculations and are widely used by traders to identify potential reversal points or breakout zones.
📊 Technical Indicators
Relative Strength Index (RSI): 57.51 (Neutral)
Average True Range (ATR): 11.34 (Indicates moderate volatility)
Moving Averages: The stock is trading below its 50-day, 100-day, and 200-day moving averages, suggesting a bearish trend.
🔍 Analysis Summary
The current price is near the support zone. A break below ₹217.36 could lead to further declines towards ₹214.02 and ₹210.11. Conversely, if the stock holds above ₹224.61, it may attempt to retest resistance levels at ₹228.52 and ₹231.86. Traders should watch for significant price action near these levels to assess potential breakout or breakdown scenarios.
Penerbitan berkaitan
Penafian
Maklumat dan penerbitan adalah tidak dimaksudkan untuk menjadi, dan tidak membentuk, nasihat untuk kewangan, pelaburan, perdagangan dan jenis-jenis lain atau cadangan yang dibekalkan atau disahkan oleh TradingView. Baca dengan lebih lanjut di Terma Penggunaan.
Penerbitan berkaitan
Penafian
Maklumat dan penerbitan adalah tidak dimaksudkan untuk menjadi, dan tidak membentuk, nasihat untuk kewangan, pelaburan, perdagangan dan jenis-jenis lain atau cadangan yang dibekalkan atau disahkan oleh TradingView. Baca dengan lebih lanjut di Terma Penggunaan.