POLO HOTELS LTD – Penny Stock with just 28cr Market Cap and Very Less Volume Stock [Rounding Bottom Pattern]
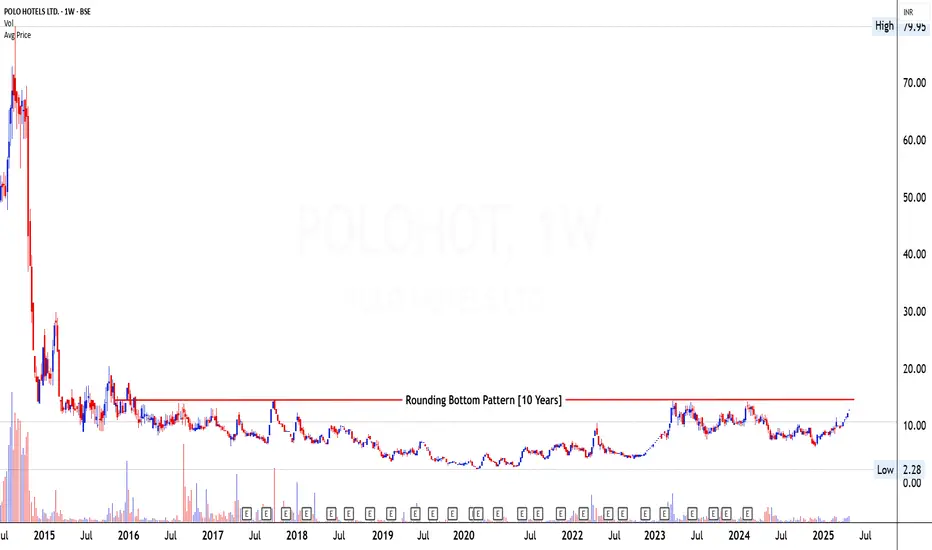
1. Pattern Analysis
The chart shows the development of a Rounding Bottom Pattern over a 10-year timeframe, which fits the strict requirement for a valid long-term accumulation base. This kind of formation often indicates a significant change in trend and investor sentiment over the years. The resistance zone around ₹14–₹15, marked in red, represents a critical neckline. However, despite the ideal structure, the stock is currently testing but has not yet broken out of this resistance.
2. Volume Analysis
A major concern in this setup is very low trading volume, both during the accumulation phase and in the most recent sessions. Liquidity is extremely limited, with thin volume bars visible throughout the 10-year base. Such low volumes suggest a lack of broader market participation and could hinder the effectiveness of the breakout if and when it occurs. This greatly reduces the tradability of the setup, as illiquid stocks carry higher slippage and execution risk.
3. Candlestick or Price Analysis
The price structure itself is technically appealing, with a smooth bottoming curve and higher lows forming gradually. The recent candles leading up to the ₹13–₹14 level are relatively strong and consistent with the final leg of a rounding base, but the lack of price spread and small body candles further highlights the illiquidity and potential manipulation or lack of institutional interest.
4. Validation of Signal
While the rounding bottom pattern is nearly complete and technically valid, there is no confirmed breakout yet above the resistance. More importantly, the signal lacks volume confirmation, which is critical in validating any bullish setup—especially for a pattern of this magnitude. Therefore, this setup, despite its structure, cannot currently be considered a reliable bullish breakout opportunity.
5. Tradable Points Determination
Entry Point Determination: Entry should not be considered unless there is a clear breakout above ₹15 with strong volume backing it, which is currently absent.
Target Point Determination: If a breakout were to occur with volume, the pattern would theoretically target levels between ₹25–₹30, based on the depth of the rounding bottom.
Stop Loss Placement and Trailing SL Follow-Up: Any theoretical entry above ₹15 would require a stop loss below ₹10, but this is speculative given the stock's illiquidity.
Learn Today for Better Tomorrow
Penafian
Maklumat dan penerbitan adalah tidak dimaksudkan untuk menjadi, dan tidak membentuk, nasihat untuk kewangan, pelaburan, perdagangan dan jenis-jenis lain atau cadangan yang dibekalkan atau disahkan oleh TradingView. Baca dengan lebih lanjut di Terma Penggunaan.