hi traders
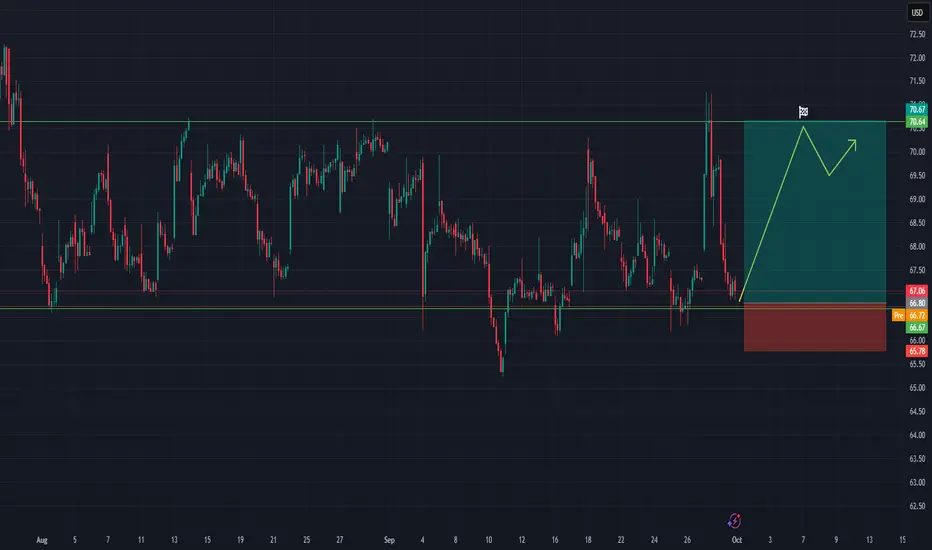
PayPal is currently trading around $66.80 – $67.00 after retesting a key support level that has held multiple times in recent sessions. The price action shows consolidation near support, with potential for a bullish reversal.
Entry Zone:
Around $66.80 – $67.00 (current support area).
Stop Loss (SL):
Below $65.78 (recent swing low and invalidation zone).
Take Profit (TP):
Targeting $70.60 – $70.70 (strong resistance and recent highs).
Risk/Reward Ratio (RRR):
Approximately 1:3, favorable setup for a long position.
Trade Thesis:
The chart suggests a bounce from support with momentum building for an upside move.
If the price holds above the $66.80 support zone, there is room for a bullish push toward the $70.60 resistance.
Confirmation can come from bullish candles forming around the current level.
Plan:
Go long near $67.00.
Place stop below $65.78.
Aim for $70.60+ as the first profit target.
Partial profits may be secured on the way up, with stop moved to breakeven for risk management.
Dagangan ditutup: sasaran tercapai
target reached.💥 Free signals and ideas ➡ t.me/vfinvestment
Penafian
The information and publications are not meant to be, and do not constitute, financial, investment, trading, or other types of advice or recommendations supplied or endorsed by TradingView. Read more in the Terms of Use.
💥 Free signals and ideas ➡ t.me/vfinvestment
Penafian
The information and publications are not meant to be, and do not constitute, financial, investment, trading, or other types of advice or recommendations supplied or endorsed by TradingView. Read more in the Terms of Use.