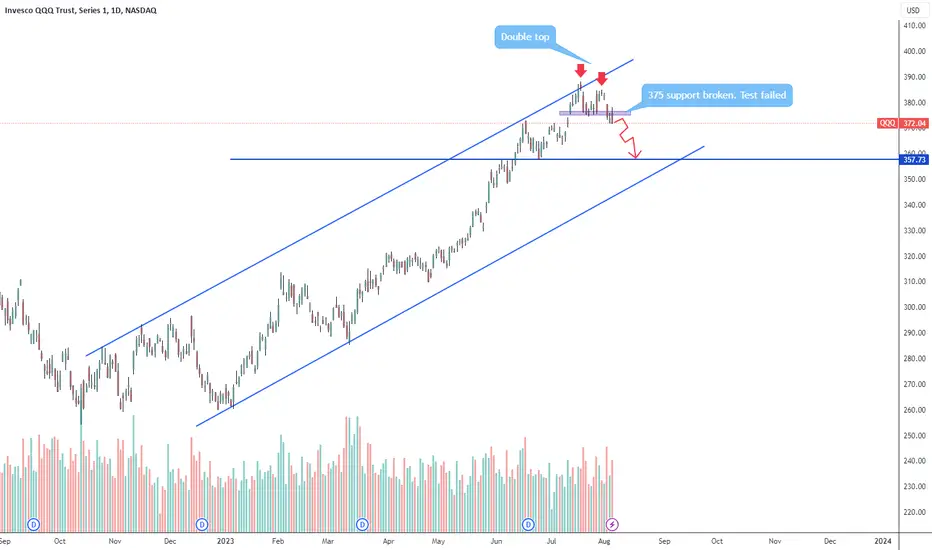
Double top confirmed in the daily timeframe. I think we are going to see a correction towards the 360 zone. I'm not trading this, I haven't had much success trading indexes, I prefer stocks. It's very possible that bulls push the price again to the $375 zone now resistance. That's the thing with indexes, sometimes looks like a free fall but suddenly buyers come out from nothing and push the price up for a day or two and puts expire. Don't tell that never happened to you. I use this to see the sentiment of the market. Yesterday I bought a bunch of puts of AAL, MRNA, AMD, CROCS and TXN, all showing strong bearish patterns. At every pull back up I will buy more.
Nota
Let me revise my previous analysis. I find the chart below more accurate. We will see a final push to the downside this week. There is a lot of support at the 365 level. I think we may also see a false break down (watch out bears) and then a hard rejection off the support. In the mean time I'm closing my shorts and adding to my longs at every dip.Penafian
Maklumat dan penerbitan adalah tidak dimaksudkan untuk menjadi, dan tidak membentuk, nasihat untuk kewangan, pelaburan, perdagangan dan jenis-jenis lain atau cadangan yang dibekalkan atau disahkan oleh TradingView. Baca dengan lebih lanjut di Terma Penggunaan.
Penafian
Maklumat dan penerbitan adalah tidak dimaksudkan untuk menjadi, dan tidak membentuk, nasihat untuk kewangan, pelaburan, perdagangan dan jenis-jenis lain atau cadangan yang dibekalkan atau disahkan oleh TradingView. Baca dengan lebih lanjut di Terma Penggunaan.
