🎯 RKLB's Technical Blueprint: Is a Power-Up Imminent? 🪐
Rocket Lab (RKLB) has presented a fascinating technical picture, displaying classical chart patterns that suggest a potential bullish continuation after a period of consolidation. My analysis points to key levels to monitor for future price action.
In summary, Rocket Lab's price went high due to the initial SPAC-driven excitement, coupled with a solid operational track record, a strategic pivot to vertical integration (beyond just launch), significant customer wins, and ambitious future plans (like Neutron) that promise to unlock larger market opportunities. It is crucial for investors to understand that Rocket Lab (RKLB) is a high-risk, high-reward long-term investment, and while the technical setup appears promising for a bullish continuation, market dynamics and company-specific developments will ultimately dictate its future trajectory. Monitor the identified support levels closely for confirmation of a potential move higher.
Disclaimer:
The information provided in this chart is for educational and informational purposes only and should not be considered as investment advice. Trading and investing involve substantial risk and are not suitable for every investor. You should carefully consider your financial situation and consult with a financial advisor before making any investment decisions. The creator of this chart does not guarantee any specific outcome or profit and is not responsible for any losses incurred as a result of using this information. Past performance is not indicative of future results. Use this information at your own risk. This chart has been created for my own improvement in Trading and Investment Analysis. Please do your own analysis before any investments.
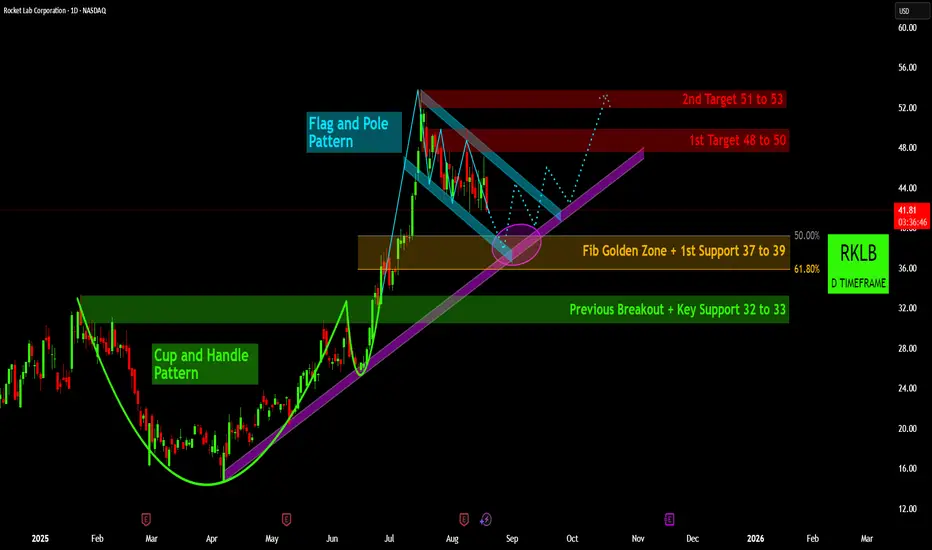
Rocket Lab (RKLB) has presented a fascinating technical picture, displaying classical chart patterns that suggest a potential bullish continuation after a period of consolidation. My analysis points to key levels to monitor for future price action.
- Foundation for Growth:The Cup and Handle Breakout: Earlier in the year, RKLB successfully formed and broke out of a well-defined Cup and Handle Pattern 📈, a classic bullish continuation signal. This robust formation propelled the stock into a strong rally, establishing significant upward momentum and highlighting investor conviction following its previous consolidation. This breakout set the stage for the subsequent price discovery at higher levels.
in.tradingview.com/support/solutions/43000732556-chart-pattern-cup-and-handle/ - Current Consolidation: The Flag and Pole Pattern: Following the sharp upward move, RKLB has entered a Flag and Pole Pattern 📉. Price action is currently consolidating within a descending channel, typical of a healthy correction after a strong run. This pattern often serves as a pause before the next leg up, allowing the market to absorb gains and gather energy for another significant move. Traders are keenly observing this phase for a decisive breakout.
in.tradingview.com/ideas/flagandpolepattern/ - Critical Confluence Zone for Reversal: The stock is currently approaching a highly significant confluence zone 🟣. This area around $37 to $39 (identified as the "1st Support") aligns perfectly with the Fibonacci Golden Zone (50%-61.8%) and the lower boundary of the descending flag channel. Furthermore, a long-term ascending trendline provides additional underlying support in this same region. This convergence of multiple support indicators makes this zone a high-probability area for a potential bullish reversal and rebound. Below this, Key Support at $32 to $33 (the "Previous Breakout" level) stands as a crucial backup.
in.tradingview.com/support/solutions/43000518158-fib-retracement/ - Upside Potential and Price Targets: Should RKLB successfully find support within this identified confluence zone and break out of the descending flag pattern, significant upside targets come into play. Our analysis identifies an initial 1st Target range of $48 to $50 🎯, followed by a 2nd Target range of $51 to $53 🎯. The projected trajectory from a successful bounce within the confluence zone supports a move towards these higher price levels, confirming the continuation of the underlying bullish trend.
In summary, Rocket Lab's price went high due to the initial SPAC-driven excitement, coupled with a solid operational track record, a strategic pivot to vertical integration (beyond just launch), significant customer wins, and ambitious future plans (like Neutron) that promise to unlock larger market opportunities. It is crucial for investors to understand that Rocket Lab (RKLB) is a high-risk, high-reward long-term investment, and while the technical setup appears promising for a bullish continuation, market dynamics and company-specific developments will ultimately dictate its future trajectory. Monitor the identified support levels closely for confirmation of a potential move higher.
Disclaimer:
The information provided in this chart is for educational and informational purposes only and should not be considered as investment advice. Trading and investing involve substantial risk and are not suitable for every investor. You should carefully consider your financial situation and consult with a financial advisor before making any investment decisions. The creator of this chart does not guarantee any specific outcome or profit and is not responsible for any losses incurred as a result of using this information. Past performance is not indicative of future results. Use this information at your own risk. This chart has been created for my own improvement in Trading and Investment Analysis. Please do your own analysis before any investments.
Penafian
Maklumat dan penerbitan adalah tidak bertujuan, dan tidak membentuk, nasihat atau cadangan kewangan, pelaburan, dagangan atau jenis lain yang diberikan atau disahkan oleh TradingView. Baca lebih dalam Terma Penggunaan.
Penafian
Maklumat dan penerbitan adalah tidak bertujuan, dan tidak membentuk, nasihat atau cadangan kewangan, pelaburan, dagangan atau jenis lain yang diberikan atau disahkan oleh TradingView. Baca lebih dalam Terma Penggunaan.