📌 Current Price Context
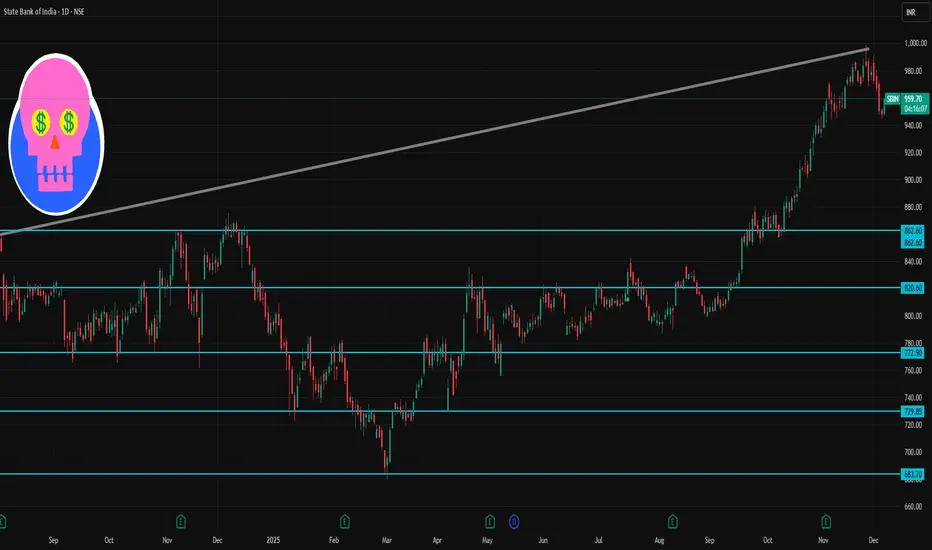
According to recent sources, SBI is trading around ₹949–₹957 (NSE/BSE) depending on the feed.
Its 52‑week trading range remains roughly ₹680 (low) to ₹999 (high).
🎯 What to Watch: Possible Scenarios
Bullish bias: If price holds above pivot (~₹988) and breaks above R1 (~₹994.5), watch for a move toward ~₹1005–₹1010+.
Neutral / Range‑bound: If price oscillates between support (~₹977–₹971) and pivot/resistance zone (~₹988–₹994), expect sideways movement.
Bearish bias: Break and close below S2/S3 (~₹971–₹960) might open downside — next major cushion near ~₹950–₹940.
Penerbitan berkaitan
Penafian
Maklumat dan penerbitan adalah tidak bertujuan, dan tidak membentuk, nasihat atau cadangan kewangan, pelaburan, dagangan atau jenis lain yang diberikan atau disahkan oleh TradingView. Baca lebih dalam Terma Penggunaan.
Penerbitan berkaitan
Penafian
Maklumat dan penerbitan adalah tidak bertujuan, dan tidak membentuk, nasihat atau cadangan kewangan, pelaburan, dagangan atau jenis lain yang diberikan atau disahkan oleh TradingView. Baca lebih dalam Terma Penggunaan.