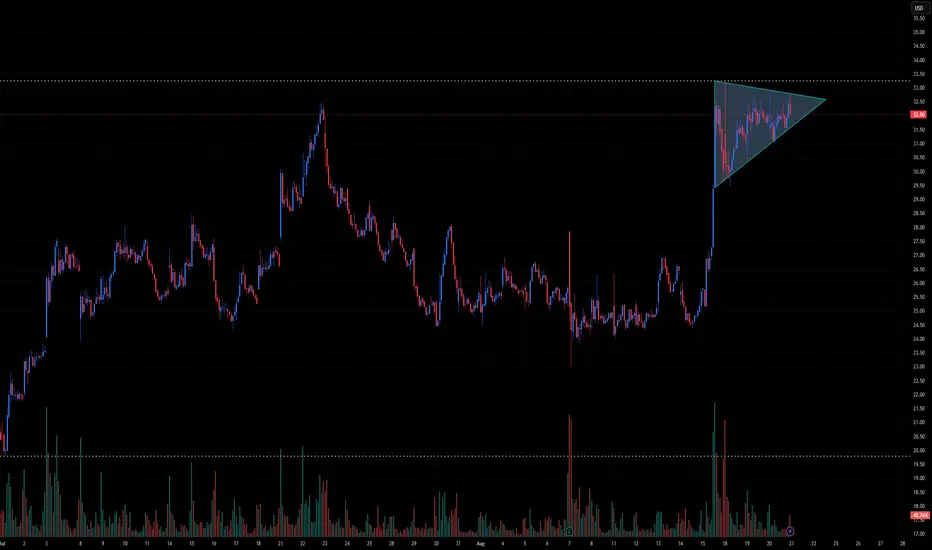
☀️ SEDG Technical Outlook – Symmetrical Triangle After Breakout Run
Ticker: SEDG (SolarEdge Technologies)
Timeframe: 30-minute candles
🔍 Current Setup
SEDG staged a sharp rally from ~$26 to ~$32.50, followed by a consolidation into a symmetrical triangle pattern. This setup represents a bullish continuation pattern, where buyers digest gains before attempting another leg higher.
Triangle Resistance: ~32.80–33.00
Triangle Support: ~31.80
Current price: ~32.10, near the triangle apex.
📊 Breakout Levels
🚀 Upside (Bullish Scenario)
Trigger: Break and close above 33.00.
Intermediate Targets:
34.00–34.50 → First supply zone.
35.50 → Extension target.
Measured Move Target: ~37.00 (projected from triangle height).
🔻 Downside (Bearish Scenario)
Trigger: Break below 31.80, then 30.80.
Intermediate Supports:
30.00 → Round number support.
28.50–28.00 → Demand zone.
Measured Move Target: ~27.00 (triangle height projection downward).
📈 Volume Analysis
Volume expanded during the initial rally but has contracted during consolidation — a classic sign of a triangle pattern.
Expect a sharp volume spike on breakout, confirming the move’s direction.
⚖️ Probability Bias
Given the strong uptrend leading into the triangle, the bias favors a bullish continuation if resistance at 33.00 is cleared.
However, failure to hold 31.80–30.80 would negate the bullish setup and reintroduce sellers.
✅ Takeaway
SEDG is at a critical inflection point within a bullish continuation pattern:
Bullish Break > 33.00: Targets 34.50 → 35.50 → 37.00
Bearish Break < 31.80 / 30.80: Targets 30.00 → 28.50 → 27.00
Watch for volume confirmation to validate the breakout direction.
Penafian
Maklumat dan penerbitan adalah tidak bertujuan, dan tidak membentuk, nasihat atau cadangan kewangan, pelaburan, dagangan atau jenis lain yang diberikan atau disahkan oleh TradingView. Baca lebih dalam Terma Penggunaan.
Penafian
Maklumat dan penerbitan adalah tidak bertujuan, dan tidak membentuk, nasihat atau cadangan kewangan, pelaburan, dagangan atau jenis lain yang diberikan atau disahkan oleh TradingView. Baca lebih dalam Terma Penggunaan.