📊 Bullish Thesis: Shifa International Hospitals Ltd (PSX: SHFA)
Shifa International Hospitals continues to demonstrate strong fundamental performance across key financial metrics, supporting a bullish long-term outlook:
🔹 Growth Metrics (CAGR-based)
Revenue CAGR: 13.37%
Operating Profit CAGR: 23.47%
Net Income CAGR: 24.14%
These indicate a healthy expansion in top-line and bottom-line over the evaluated period. The high Operating Profit CAGR outpacing revenue growth shows strong cost control and operational efficiency.
🔹 Profitability Ratios
Operating Margin: 14.35%
Net Margin: 8.02%
Return on Invested Capital (ROIC): 8.47%
Margins remain solid, indicating good pricing power and disciplined cost management. ROIC near 8.5% confirms efficient capital allocation in a capital-intensive healthcare sector.
🔹 Cash Flow & Taxation
CCFO vs CPAT: ✅ Positive cash flow support
Tax %: 43.33% – indicates compliance and contribution at a healthy level
🔹 Other Key Financial Indicators
COGS %: 84.94% – consistent with healthcare service delivery models
TTM Diff: +204.08% – massive improvement in trailing twelve-months performance, likely due to post-COVID healthcare demand normalization and operational leverage.
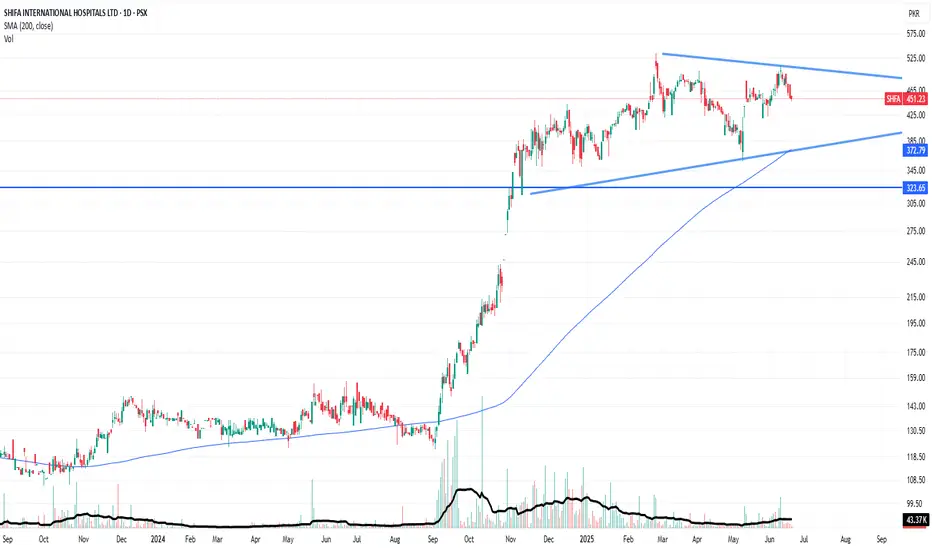
I will wait till 390 price to take a bullish stance in this stock.
Shifa International Hospitals continues to demonstrate strong fundamental performance across key financial metrics, supporting a bullish long-term outlook:
🔹 Growth Metrics (CAGR-based)
Revenue CAGR: 13.37%
Operating Profit CAGR: 23.47%
Net Income CAGR: 24.14%
These indicate a healthy expansion in top-line and bottom-line over the evaluated period. The high Operating Profit CAGR outpacing revenue growth shows strong cost control and operational efficiency.
🔹 Profitability Ratios
Operating Margin: 14.35%
Net Margin: 8.02%
Return on Invested Capital (ROIC): 8.47%
Margins remain solid, indicating good pricing power and disciplined cost management. ROIC near 8.5% confirms efficient capital allocation in a capital-intensive healthcare sector.
🔹 Cash Flow & Taxation
CCFO vs CPAT: ✅ Positive cash flow support
Tax %: 43.33% – indicates compliance and contribution at a healthy level
🔹 Other Key Financial Indicators
COGS %: 84.94% – consistent with healthcare service delivery models
TTM Diff: +204.08% – massive improvement in trailing twelve-months performance, likely due to post-COVID healthcare demand normalization and operational leverage.
I will wait till 390 price to take a bullish stance in this stock.
Penafian
Maklumat dan penerbitan adalah tidak bertujuan, dan tidak membentuk, nasihat atau cadangan kewangan, pelaburan, dagangan atau jenis lain yang diberikan atau disahkan oleh TradingView. Baca lebih dalam Terma Penggunaan.
Penafian
Maklumat dan penerbitan adalah tidak bertujuan, dan tidak membentuk, nasihat atau cadangan kewangan, pelaburan, dagangan atau jenis lain yang diberikan atau disahkan oleh TradingView. Baca lebih dalam Terma Penggunaan.