🚀 SHRIRAMFIN - Monthly Chart Analysis: All-Time High Breakout in NBFC Giant! 💰
Symbol: SHRIRAMFIN | Exchange: NSE | Timeframe: 1 Month | Theme: Multi-Year Breakout & Trend Continuation
The monthly chart for Shriram Finance Ltd. (SHRIRAMFIN) presents a phenomenal technical picture, confirming a powerful multi-year breakout, which signals the potential for significant long-term capital appreciation.
📈 Key Technical Structure & Breakout Confirmation
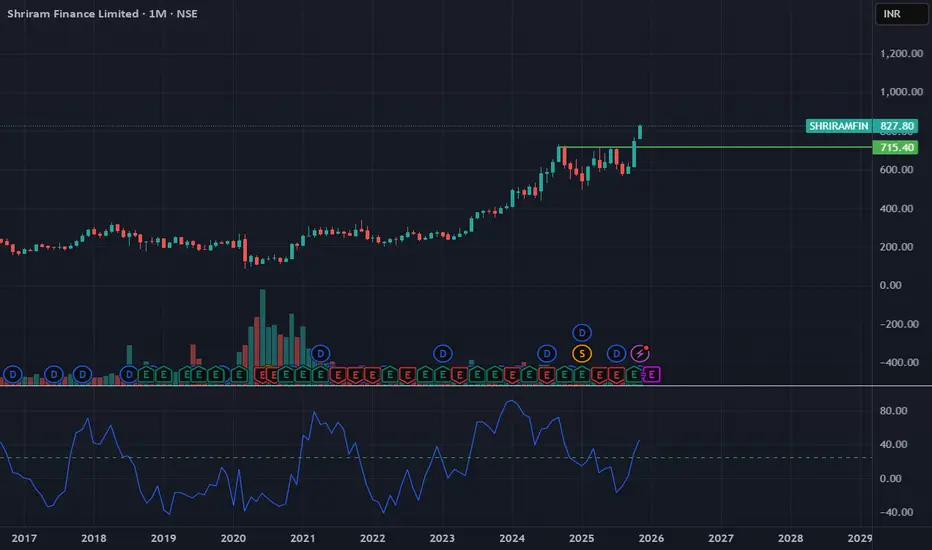
Decisive All-Time High (ATH) Breakout: The most compelling feature is the recent price action (Current Price: ₹748.90) which has cleanly surpassed the previous multi-year peak/resistance zone around ₹715.40. A breakout on a monthly timeframe is a high-conviction signal, confirming the ascendancy of the stock into a new price discovery phase.
Consolidation Base: The stock spent several months consolidating just below the major resistance of ₹715.40 (the horizontal green line). This base formation is structurally healthy, as it absorbs supply and builds energy for the eventual breakout. The sharp, decisive move in the current month confirms the successful completion of this phase.
Volume Profile: While not explicitly marked, the sustained long-term rally from 2022 to 2024 has been backed by robust volume accumulation, suggesting strong institutional interest. The breakout month should ideally be supported by higher-than-average volume, adding credibility to the move.
RSI Momentum: The Relative Strength Index (RSI) on the monthly chart is trending strongly upwards (currently around the 60-70 zone, based on market data), which confirms the powerful bullish momentum and indicates that the stock is not yet severely overbought on this long-term scale, leaving room for further gains.
🎯 Trading Strategy & Target Projections
1. Immediate Targets (Price Discovery)
With the ATH level of ₹715.40 breached, the stock is in uncharted territory. We use classic charting techniques (Fibonacci extensions, psychological levels) to project targets:
Psychological Target 1 (T1): ₹1000.00
Technical Target 2 (T2): ₹1840.00 - ₹1850.00 (This aligns with price targets recently set by major institutional brokerages, reinforcing the technical view with fundamental estimates.)
2. Key Support & Risk Management
Immediate Support (Breakout Retest): The most critical level to watch is the newly converted support zone at the previous ATH: ₹710.00 - ₹715.40. Any successful retest of this zone would offer a high-probability entry point.
Positional Stop-Loss: A decisive monthly close below ₹630.00 (below the body of the last major swing low before the rally) would invalidate the current bullish structure on the long-term chart.
💡 Analyst Commentary & Outlook
The technical breakout is strongly supported by the fundamental strength of the NBFC sector and Shriram Finance's consistent business performance.
Strong Fundamentals: Shriram Finance is demonstrating healthy growth in Assets Under Management (AUM) and an improvement in asset quality, leading to raised price targets by analysts.
Conclusion: The breakout on the monthly chart signals a long-term trend continuation. SHRIRAMFIN is an excellent chart for positional traders and long-term investors looking to ride the next major leg of the uptrend in the financial services space.
Symbol: SHRIRAMFIN | Exchange: NSE | Timeframe: 1 Month | Theme: Multi-Year Breakout & Trend Continuation
The monthly chart for Shriram Finance Ltd. (SHRIRAMFIN) presents a phenomenal technical picture, confirming a powerful multi-year breakout, which signals the potential for significant long-term capital appreciation.
📈 Key Technical Structure & Breakout Confirmation
Decisive All-Time High (ATH) Breakout: The most compelling feature is the recent price action (Current Price: ₹748.90) which has cleanly surpassed the previous multi-year peak/resistance zone around ₹715.40. A breakout on a monthly timeframe is a high-conviction signal, confirming the ascendancy of the stock into a new price discovery phase.
Consolidation Base: The stock spent several months consolidating just below the major resistance of ₹715.40 (the horizontal green line). This base formation is structurally healthy, as it absorbs supply and builds energy for the eventual breakout. The sharp, decisive move in the current month confirms the successful completion of this phase.
Volume Profile: While not explicitly marked, the sustained long-term rally from 2022 to 2024 has been backed by robust volume accumulation, suggesting strong institutional interest. The breakout month should ideally be supported by higher-than-average volume, adding credibility to the move.
RSI Momentum: The Relative Strength Index (RSI) on the monthly chart is trending strongly upwards (currently around the 60-70 zone, based on market data), which confirms the powerful bullish momentum and indicates that the stock is not yet severely overbought on this long-term scale, leaving room for further gains.
🎯 Trading Strategy & Target Projections
1. Immediate Targets (Price Discovery)
With the ATH level of ₹715.40 breached, the stock is in uncharted territory. We use classic charting techniques (Fibonacci extensions, psychological levels) to project targets:
Psychological Target 1 (T1): ₹1000.00
Technical Target 2 (T2): ₹1840.00 - ₹1850.00 (This aligns with price targets recently set by major institutional brokerages, reinforcing the technical view with fundamental estimates.)
2. Key Support & Risk Management
Immediate Support (Breakout Retest): The most critical level to watch is the newly converted support zone at the previous ATH: ₹710.00 - ₹715.40. Any successful retest of this zone would offer a high-probability entry point.
Positional Stop-Loss: A decisive monthly close below ₹630.00 (below the body of the last major swing low before the rally) would invalidate the current bullish structure on the long-term chart.
💡 Analyst Commentary & Outlook
The technical breakout is strongly supported by the fundamental strength of the NBFC sector and Shriram Finance's consistent business performance.
Strong Fundamentals: Shriram Finance is demonstrating healthy growth in Assets Under Management (AUM) and an improvement in asset quality, leading to raised price targets by analysts.
Conclusion: The breakout on the monthly chart signals a long-term trend continuation. SHRIRAMFIN is an excellent chart for positional traders and long-term investors looking to ride the next major leg of the uptrend in the financial services space.
Penafian
The information and publications are not meant to be, and do not constitute, financial, investment, trading, or other types of advice or recommendations supplied or endorsed by TradingView. Read more in the Terms of Use.
Penafian
The information and publications are not meant to be, and do not constitute, financial, investment, trading, or other types of advice or recommendations supplied or endorsed by TradingView. Read more in the Terms of Use.