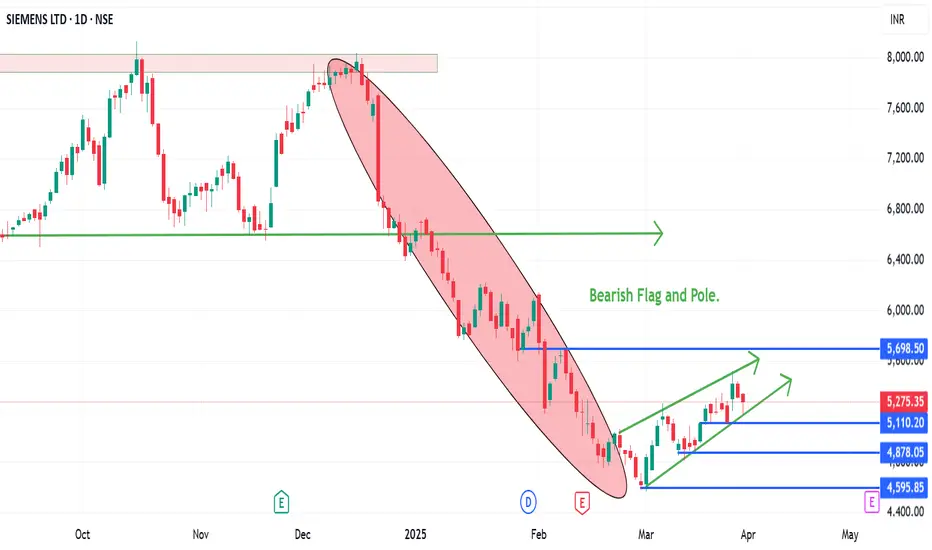
A bearish Flag and pole pattern in Siemens.
The stock has fell from 8000 to 4600 and recovered back to 5300. If there is a break down of the parallel channel, it can retest the recent low of 4600.
It is trading below 100 and 200 EMA on the daily charts. There will be resistance from the levels.
Wait for the break down and let stock price test the recent low.
Enter only once the stock has given a break down, else avoid entering the short trade.
Penerbitan berkaitan
Penafian
Maklumat dan penerbitan adalah tidak dimaksudkan untuk menjadi, dan tidak membentuk, nasihat untuk kewangan, pelaburan, perdagangan dan jenis-jenis lain atau cadangan yang dibekalkan atau disahkan oleh TradingView. Baca dengan lebih lanjut di Terma Penggunaan.
Penerbitan berkaitan
Penafian
Maklumat dan penerbitan adalah tidak dimaksudkan untuk menjadi, dan tidak membentuk, nasihat untuk kewangan, pelaburan, perdagangan dan jenis-jenis lain atau cadangan yang dibekalkan atau disahkan oleh TradingView. Baca dengan lebih lanjut di Terma Penggunaan.