SIMO: Recovery To All Time Highs?
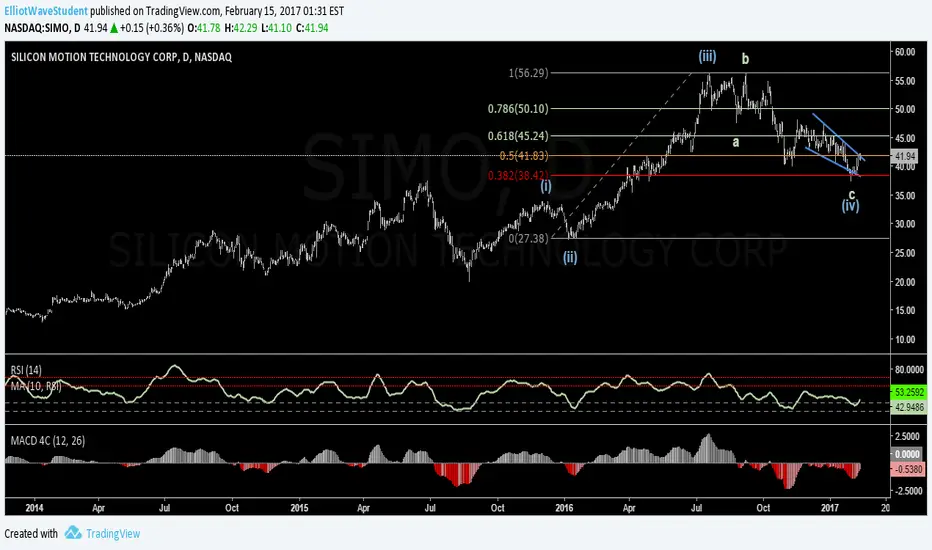
SIMO has retraced a significant amount of its Wave (iii) upside from its all time high $56.21 in Jul 2016.
Fibonacci: It appears to have bottomed up and rebounded from its 61.8% retracement.
Indicators: Momentum divergence of RSI and MACD is supportive of the analysis.
Look for a conclusive break above the Ending Diagonal for a high confidence trade.
If the expanded FLAT is indeed completed, look for upside northwards of $56.21.
Any break below its ending diagonal low at 37.37 will invalidate this trade and indicate other options.
Nota
Retracement appears to be completed.Prices are moving in the anticipated direction.
Watch for strong break of trend channel to confirm breakout to near term high at $56.25 and beyond.
Break of Critical Support will invalidate this analysis.
Nota
Prices appeared to have completed Minuette Wave 4.Watch for a retracement test of the criticial support (Dotted Red).
A successful retracement will result in upward price target of $56.21 onwards.
A break of this critical support will invalidate this trade.
Dagangan aktif
Consolidation appears complete.Trade at your own time and target.
Dagangan ditutup: sasaran tercapai
Penafian
Maklumat dan penerbitan adalah tidak dimaksudkan untuk menjadi, dan tidak membentuk, nasihat untuk kewangan, pelaburan, perdagangan dan jenis-jenis lain atau cadangan yang dibekalkan atau disahkan oleh TradingView. Baca dengan lebih lanjut di Terma Penggunaan.
Penafian
Maklumat dan penerbitan adalah tidak dimaksudkan untuk menjadi, dan tidak membentuk, nasihat untuk kewangan, pelaburan, perdagangan dan jenis-jenis lain atau cadangan yang dibekalkan atau disahkan oleh TradingView. Baca dengan lebih lanjut di Terma Penggunaan.