Panjang
Potential Long Trade on SLXP
Before we begin, we need to understand the macro trend of the market. Taking a close look at where NASDAQ and S&P 500 is heading to, we need to exercise a bit of caution as both indexes have broken down their 50 days moving averages.
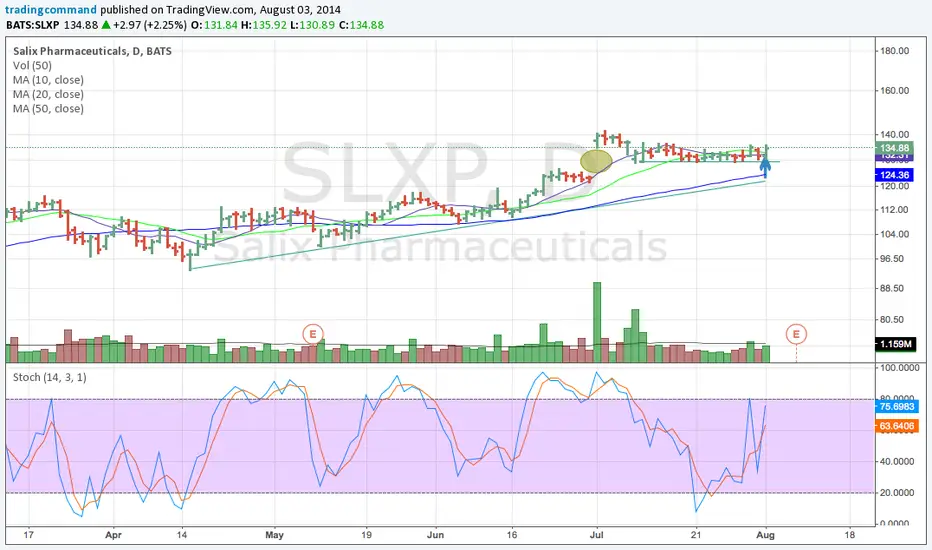
SLXP has been on a uptrend since May 2014 and is well supported at price level $130 after the gap up on 1 Jul 2014. It is also well above the 50 days moving average. Recent price action shows consolidation and suggests an possible breakout to a new high if market permit.
Hopefully SLXP can move up from here despite the weakness in the market as we take a bullish view on SLXP.
Penafian
Maklumat dan penerbitan adalah tidak dimaksudkan untuk menjadi, dan tidak membentuk, nasihat untuk kewangan, pelaburan, perdagangan dan jenis-jenis lain atau cadangan yang dibekalkan atau disahkan oleh TradingView. Baca dengan lebih lanjut di Terma Penggunaan.
Penafian
Maklumat dan penerbitan adalah tidak dimaksudkan untuk menjadi, dan tidak membentuk, nasihat untuk kewangan, pelaburan, perdagangan dan jenis-jenis lain atau cadangan yang dibekalkan atau disahkan oleh TradingView. Baca dengan lebih lanjut di Terma Penggunaan.