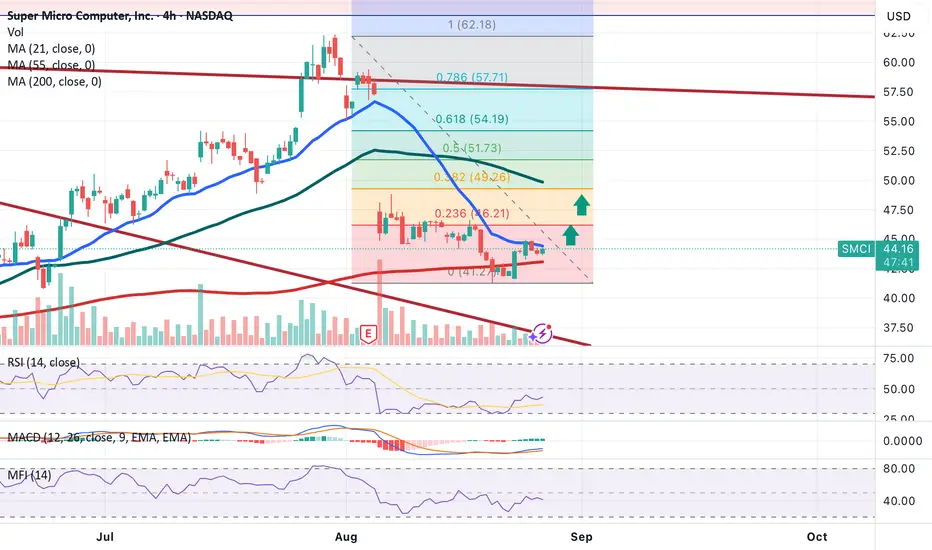
📊 SMCI Technical Analysis (4H Chart)
SMCI price action has rebounded strongly from the 200-period moving average, confirming it as a key dynamic support zone.
✅ This bounce signals renewed bullish momentum.
🎯 Upside targets to watch:
First target: $46.21
Second target: $49.26
As long as price holds above the 200 MA, the bullish outlook remains intact. A break below would invalidate this setup.
Dagangan aktif
🎯 SMCI First price target of $46.21 successfully reached.
✅ Target 1: Hit
🔄 Awaiting continuation toward next resistance/target zone.
Holding long — setup still valid unless key support breaks.
📌 Stay tuned for the next level!
Penafian
Maklumat dan penerbitan adalah tidak dimaksudkan untuk menjadi, dan tidak membentuk, nasihat untuk kewangan, pelaburan, perdagangan dan jenis-jenis lain atau cadangan yang dibekalkan atau disahkan oleh TradingView. Baca dengan lebih lanjut di Terma Penggunaan.
Penafian
Maklumat dan penerbitan adalah tidak dimaksudkan untuk menjadi, dan tidak membentuk, nasihat untuk kewangan, pelaburan, perdagangan dan jenis-jenis lain atau cadangan yang dibekalkan atau disahkan oleh TradingView. Baca dengan lebih lanjut di Terma Penggunaan.