Nota
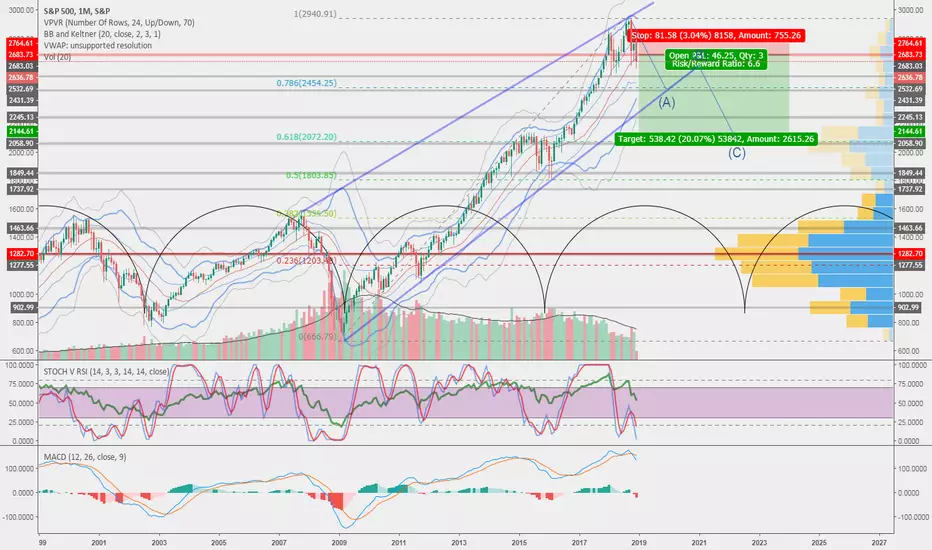
Oh shit, month chart. Too large timeframe =))) Anyway, now we all know that most probably America is going down... or someone else is risingFREE telegram channels:
Crypto reviews - t.me/WiseAnalyze
Crypto chat - t.me/WiseAnalyzeChat
Crypto watchlist - t.me/WiseAnalyzeDCA
Forex/Stocks - t.me/WiseForex
Crypto reviews - t.me/WiseAnalyze
Crypto chat - t.me/WiseAnalyzeChat
Crypto watchlist - t.me/WiseAnalyzeDCA
Forex/Stocks - t.me/WiseForex
Penafian
Maklumat dan penerbitan adalah tidak dimaksudkan untuk menjadi, dan tidak membentuk, nasihat untuk kewangan, pelaburan, perdagangan dan jenis-jenis lain atau cadangan yang dibekalkan atau disahkan oleh TradingView. Baca dengan lebih lanjut di Terma Penggunaan.
FREE telegram channels:
Crypto reviews - t.me/WiseAnalyze
Crypto chat - t.me/WiseAnalyzeChat
Crypto watchlist - t.me/WiseAnalyzeDCA
Forex/Stocks - t.me/WiseForex
Crypto reviews - t.me/WiseAnalyze
Crypto chat - t.me/WiseAnalyzeChat
Crypto watchlist - t.me/WiseAnalyzeDCA
Forex/Stocks - t.me/WiseForex
Penafian
Maklumat dan penerbitan adalah tidak dimaksudkan untuk menjadi, dan tidak membentuk, nasihat untuk kewangan, pelaburan, perdagangan dan jenis-jenis lain atau cadangan yang dibekalkan atau disahkan oleh TradingView. Baca dengan lebih lanjut di Terma Penggunaan.
