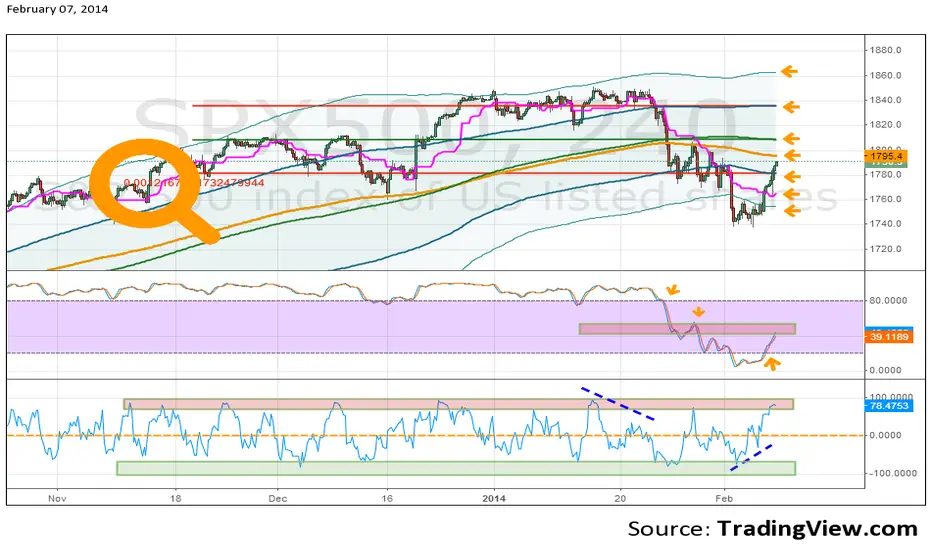
Plot LInear Regression as much as possible horizontal, close to 0.000
With the number YOU get plot EMA, BB with 1&2 deviation and Stoch.
For clues plot Ichimoku standard line and for divergence CMO or other indicators You like - settings according to your trading plan.
YOU can use this system on all timeframes - on lower timeframes You must change settings more often to plot horizontal LINREG... (use also different deviations of LINREG...
just WATCH, DECIDE, INNoVATE and make $$$ - GLT.
Penafian
Maklumat dan penerbitan adalah tidak dimaksudkan untuk menjadi, dan tidak membentuk, nasihat untuk kewangan, pelaburan, perdagangan dan jenis-jenis lain atau cadangan yang dibekalkan atau disahkan oleh TradingView. Baca dengan lebih lanjut di Terma Penggunaan.
Penafian
Maklumat dan penerbitan adalah tidak dimaksudkan untuk menjadi, dan tidak membentuk, nasihat untuk kewangan, pelaburan, perdagangan dan jenis-jenis lain atau cadangan yang dibekalkan atau disahkan oleh TradingView. Baca dengan lebih lanjut di Terma Penggunaan.