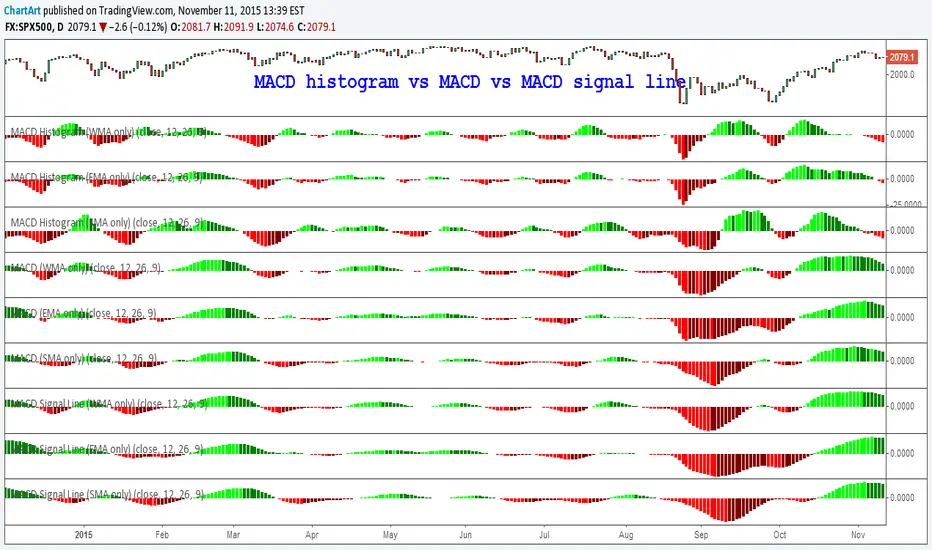
This is the final overview of my research into the MACD (Moving Average Convergence/Divergence) indicator, which is showing part 1, part 2 to part 3 all together in just one chart.
Overall there are nine MACD indicator variations on this chart, because each of the three parts is a comparisons of three different calculation methods (simple moving average vs exponential moving average vs weighted moving average) of each the three different MACD time series components:
Part 1: MACD histogram (difference between MACD and signal line)
![[STUDY] MACD. Part 1: Histogram (Comparison of moving averages)](https://s3.tradingview.com/e/eRSEmsKW_mid.png)
Part 2: MACD (difference between fast and slow moving average)
![[STUDY] MACD. Part 2: MACD (Comparison of moving averages)](https://s3.tradingview.com/d/DGqbSSAk_mid.png)
Part 3: MACD signal line (moving average of the difference between the fast and slow moving averages)
![[STUDY] MACD. Part 3 Signal Line (Comparison of moving averages)](https://s3.tradingview.com/l/LZtLjjzg_mid.png)
P.S. Here is the mathematical interpretation of the MACD indicator:
Source: stockcharts.com/school/doku.php?id=chart_school:technical_indicators:macd-histogram
According to Wikipedia "for the standard MACD filter time constants of 12 and 26 periods, the MACD derivative estimate is filtered approximately by the equivalent of a low-pass moving average filter of 38 data periods. The time derivative estimate (per period) is the MACD value divided by 14."
Source: en.wikipedia.org/wiki/MACD
Overall there are nine MACD indicator variations on this chart, because each of the three parts is a comparisons of three different calculation methods (simple moving average vs exponential moving average vs weighted moving average) of each the three different MACD time series components:
Part 1: MACD histogram (difference between MACD and signal line)
Part 2: MACD (difference between fast and slow moving average)
Part 3: MACD signal line (moving average of the difference between the fast and slow moving averages)
P.S. Here is the mathematical interpretation of the MACD indicator:
- First derivative: fast moving average (12) and slow moving average (26)
- Second derivative: MACD (fast moving average (12) less the slow moving average (26))
- Third derivative: MACD signal line (moving average (9) of MACD)
- Fourth derivative: MACD-Histogram (MACD less MACD signal line)
Source: stockcharts.com/school/doku.php?id=chart_school:technical_indicators:macd-histogram
According to Wikipedia "for the standard MACD filter time constants of 12 and 26 periods, the MACD derivative estimate is filtered approximately by the equivalent of a low-pass moving average filter of 38 data periods. The time derivative estimate (per period) is the MACD value divided by 14."
Source: en.wikipedia.org/wiki/MACD
Penerbitan berkaitan
Penafian
Maklumat dan penerbitan adalah tidak dimaksudkan untuk menjadi, dan tidak membentuk, nasihat untuk kewangan, pelaburan, perdagangan dan jenis-jenis lain atau cadangan yang dibekalkan atau disahkan oleh TradingView. Baca dengan lebih lanjut di Terma Penggunaan.
Penerbitan berkaitan
Penafian
Maklumat dan penerbitan adalah tidak dimaksudkan untuk menjadi, dan tidak membentuk, nasihat untuk kewangan, pelaburan, perdagangan dan jenis-jenis lain atau cadangan yang dibekalkan atau disahkan oleh TradingView. Baca dengan lebih lanjut di Terma Penggunaan.