Why traders are losing money
Most traders do not lose because the market is hostile or because entries are bad. They lose because the size of each position is out of sync with account size, with volatility, and with a realistic pain threshold. They also stack correlated exposure until a normal downswing becomes a career ending drawdown. The fix is a repeatable sizing process that keeps losses small, keeps risk per trade constant across regimes, and caps total open risk across the book.
Root causes of loss clustering
One principle to anchor the lesson
Risk lives in the distance between entry and stop. Size lives in how much money you are willing to risk on that distance. Everything else is detail. When you fix these two elements the account stops bleeding from one mistake and the equity curve starts to respect your personal pain limits.
The unit formula in plain words

Percent risk formula and worked example
Set a realistic risk percent
Define the stop with intent
You can define a stop by price structure or by volatility. Structure is a level that invalidates the setup. Volatility is a multiple of the average true range. Both work if you keep the rule stable. The aim is not to predict a perfect level. The aim is to measure distance so you can compute size with precision and keep loss per trade constant in money terms.
Volatility aware sizing
When the average true range doubles you must expect larger swings. If you keep the same unit count the same entry to stop distance will cost twice as much. A simple way to neutralise this effect is to tie the stop to a multiple of the average true range and then let the unit count float. When volatility rises the unit count shrinks. When volatility calms the unit count grows. Risk per trade stays constant.
Practice example
Portfolio heat in clear numbers
Portfolio heat is the sum of risk money across all open trades as a percent of account. If you allow the sum to balloon during correlated trends you are betting the entire account on one theme. A simple cap keeps you in business.

Heat includes correlated risk. Keep combined open risk under your limit
R multiple as the common unit
R is the unit that equals your risk per trade. If you risk one hundred then one R is one hundred. A two R gain is two hundred. A one R loss is one hundred. Because R normalises money across instruments and timeframes you can compare strategies without confusion. When you review your trades in R the mind stops obsessing about price and starts focusing on process.
Expectancy in words and numbers
Expectancy is the average R result per trade. It depends on win rate and payoff ratio. You do not need equations to grasp it. You can compute it with simple mental math.
Practice example A
Practice example B
The shape of expectancy changes when volatility changes. If you keep risk per trade constant and let the unit count respond to stop distance expectancy measured in R will be more stable across regimes. That stability translates into better position control and calmer decision making.
Why money management fails in practice
A position sizing workflow you can follow every time
Scaling with intent
Scaling is not a trick to force a trade to work. Scaling is a way to stage risk through time. The rule is simple. Add size only after the trade earns the right to carry more risk. Reduce risk when momentum fades or when volatility rises.
One simple scale plan

Compute size. Check heat. Execute only if rules align
Comparator versus buy and hold
Buy and hold does not respect a personal pain limit. It lets drawdown float with price. A sized trade fixes the maximum loss in money terms at the start. The difference is not ideology. The difference is the choice to survive.
Practice scenario
Kelly fraction and optimal f cautions
Kelly and optimal f are powerful in theory. They aim to maximise growth for a known edge. Real trading edges drift and sample sizes are small. Full Kelly creates deep drawdowns and can trigger a behavioural spiral. If you decide to use these methods treat the fraction as a ceiling rather than a target and remain near half Kelly or less. Always measure drawdown in R and reduce size after a loss streak.
Loss streak protocol
Loss streaks are part of variance. A simple protocol keeps them from damaging your decision cycle.
Heat management across themes
The book is a living system. A theme can be a sector a factor a style or a macro driver. If four positions express the same theme treat them as one for heat. The market does not care that the tickers differ. Correlation in stress is the rule. The heat cap is your defence against that correlation.
Fees and slippage discipline
Small edges die from friction. If your average win is near one R and your average loss is near one R you must protect that edge by keeping fees and slippage small. Choose venues with adequate liquidity. Avoid market orders during news bursts. Use limit orders to control entry and exit where practical. Assume a realistic round trip fee in your backtests so that live results match expectations.
Journaling that actually helps
Your journal should capture rules and numbers rather than emotions alone. Use a compact template.
Practice drills to build fluency
Speed matters during live markets. These drills train your sizing reflexes.
Drill one. Percent risk to units
Drill two. Volatility step change
Drill three. Futures or forex conversion
Drill four. Heat check
Checklist before every order
Common myths to retire
How to adapt across timeframes
The rules above are timeframe agnostic. Shorter timeframes require tighter execution and more attention to fees. Longer timeframes require more patience and a wider cash buffer for gaps. In both cases the math does not change. You measure distance. You set risk money. You compute units. You respect the heat cap. You review in R.
Edge drift and regime change
Edges do not vanish overnight. They drift when the crowd learns the pattern or when macro drivers shift. Your sizing process makes you resilient to drift. Because risk per trade is fixed a flat or negative edge bleeds slowly and gives you time to notice and step back. If you see expectancy in R slide over a thirty or fifty trade sample reduce size and review the rule set before you push the gas again.
Putting it all together
A trader who sizes by feel can enjoy a series of quick gains and then give it back in one week. A trader who sizes by rule can be wrong half the time and still grow steadily. The difference is not superior prediction. The difference is the choice to define loss before entry to respect volatility and to cap heat so a cluster of normal losers does not become a personal crisis.
A compact template you can copy
Bottom line
Education
Most traders do not lose because the market is hostile or because entries are bad. They lose because the size of each position is out of sync with account size, with volatility, and with a realistic pain threshold. They also stack correlated exposure until a normal downswing becomes a career ending drawdown. The fix is a repeatable sizing process that keeps losses small, keeps risk per trade constant across regimes, and caps total open risk across the book.
Root causes of loss clustering
- Risk per trade that is too large for the real account balance that is available for trading
- Stops that ignore volatility so a quiet week and a fast week carry the same unit count while loss size swings wildly
- Portfolio heat that compounds across correlated positions in the same theme or factor
- Inconsistent exits so a written stop is moved or ignored after the position is open
- Scaling rules that add size before the trade earns the right to carry more risk
- A review loop that tracks money rather than R so results are not comparable across instruments
One principle to anchor the lesson
Risk lives in the distance between entry and stop. Size lives in how much money you are willing to risk on that distance. Everything else is detail. When you fix these two elements the account stops bleeding from one mistake and the equity curve starts to respect your personal pain limits.
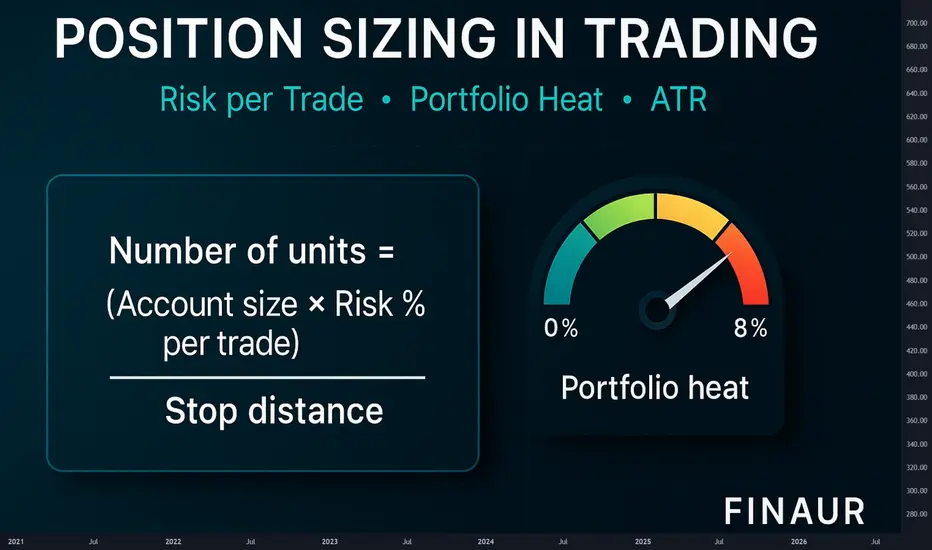
The unit formula in plain words
- Units equals Account times Risk percent divided by Stop distance
- Stop distance equals Entry minus Stop in price units
- For futures or forex convert the distance to money with tick or pip value before you divide
- Round the result to the venue step size
Percent risk formula and worked example
Set a realistic risk percent
- Pick a range between zero point two five and one point zero percent of account per trade
- If you are new stay closer to zero point two five
- If you are experienced and you follow rules under pressure stay near zero point five to one point zero
- Use only capital that is truly available for trading
Define the stop with intent
You can define a stop by price structure or by volatility. Structure is a level that invalidates the setup. Volatility is a multiple of the average true range. Both work if you keep the rule stable. The aim is not to predict a perfect level. The aim is to measure distance so you can compute size with precision and keep loss per trade constant in money terms.
Volatility aware sizing
When the average true range doubles you must expect larger swings. If you keep the same unit count the same entry to stop distance will cost twice as much. A simple way to neutralise this effect is to tie the stop to a multiple of the average true range and then let the unit count float. When volatility rises the unit count shrinks. When volatility calms the unit count grows. Risk per trade stays constant.
Practice example
- Risk money equals one hundred
- Stop distance equals three point zero in a calm regime
- Units equals one hundred divided by three which is thirty three units rounded
- If volatility doubles and the stop distance becomes six point zero the new unit count becomes sixteen units rounded
- Loss per trade stays near one hundred in both regimes
Portfolio heat in clear numbers
Portfolio heat is the sum of risk money across all open trades as a percent of account. If you allow the sum to balloon during correlated trends you are betting the entire account on one theme. A simple cap keeps you in business.
- Set a heat cap between four and eight percent of account
- Count correlated positions as one theme for heat
- If a new trade would push heat above the cap you must reduce size or defer the trade
- Keep a cash buffer for slippage and gap risk
Heat includes correlated risk. Keep combined open risk under your limit
R multiple as the common unit
R is the unit that equals your risk per trade. If you risk one hundred then one R is one hundred. A two R gain is two hundred. A one R loss is one hundred. Because R normalises money across instruments and timeframes you can compare strategies without confusion. When you review your trades in R the mind stops obsessing about price and starts focusing on process.
Expectancy in words and numbers
Expectancy is the average R result per trade. It depends on win rate and payoff ratio. You do not need equations to grasp it. You can compute it with simple mental math.
Practice example A
- Win rate equals forty five percent
- Average win equals two point two R
- Average loss equals one point zero R
- For every ten trades wins contribute nine point nine R and losses subtract five point five R
- Expectancy equals four point four R per ten trades or zero point four four R per trade before fees
Practice example B
- Win rate equals thirty five percent
- Average win equals three point zero R
- Average loss equals one point zero R
- For every ten trades wins contribute ten point five R and losses subtract six point five R
- Expectancy equals four point zero R per ten trades or zero point four R per trade before fees
The shape of expectancy changes when volatility changes. If you keep risk per trade constant and let the unit count respond to stop distance expectancy measured in R will be more stable across regimes. That stability translates into better position control and calmer decision making.
Why money management fails in practice
- Traders set a risk percent but do not compute units from entry and stop before the order
- They move the stop after position entry and invalidate the size calculation
- They add to losers because the entry feels almost right and average down risk with no plan
- They never reduce size after a loss streak so the book enters a feedback loop where a normal downswing becomes a spiral
- They treat wins as proof of skill and losses as anomalies rather than counting both in R and accepting variance
A position sizing workflow you can follow every time
- Write the setup and the trigger in one line
- Define the stop with a structure rule or with a multiple of the average true range
- Measure the stop distance in price units
- Select the risk percent that fits your current equity and your mental state
- Convert the stop distance to money if the instrument uses ticks or pips
- Compute units as Account times Risk percent divided by Stop distance
- Round to the venue step size and check that the notional fits practical constraints
- Place the order only after the number of units is in the ticket and the stop is written
Scaling with intent
Scaling is not a trick to force a trade to work. Scaling is a way to stage risk through time. The rule is simple. Add size only after the trade earns the right to carry more risk. Reduce risk when momentum fades or when volatility rises.
One simple scale plan
- Enter half size when volatility is rising or when the theme is crowded
- Add the second half only after the trade moves one R in your favour
- Move the stop to reduce open risk when the second half is added
- Do not exceed the heat cap across the book after the add
Compute size. Check heat. Execute only if rules align
Comparator versus buy and hold
Buy and hold does not respect a personal pain limit. It lets drawdown float with price. A sized trade fixes the maximum loss in money terms at the start. The difference is not ideology. The difference is the choice to survive.
Practice scenario
- Price falls ten percent after entry in a fast regime
- A buy and hold position shows a ten percent account drawdown if one position equals the entire account
- A sized trade with one percent risk shows a one percent account drawdown by design
- The sized trade can take many attempts because capital is preserved for the next signal
Kelly fraction and optimal f cautions
Kelly and optimal f are powerful in theory. They aim to maximise growth for a known edge. Real trading edges drift and sample sizes are small. Full Kelly creates deep drawdowns and can trigger a behavioural spiral. If you decide to use these methods treat the fraction as a ceiling rather than a target and remain near half Kelly or less. Always measure drawdown in R and reduce size after a loss streak.
Loss streak protocol
Loss streaks are part of variance. A simple protocol keeps them from damaging your decision cycle.
- After four consecutive losses reduce risk per trade by half
- Freeze adds and focus on clean entries only
- Review the last ten trades in R and tag any rule violations
- Return to the base risk percent only after a new equity high or after a full week of clean execution
Heat management across themes
The book is a living system. A theme can be a sector a factor a style or a macro driver. If four positions express the same theme treat them as one for heat. The market does not care that the tickers differ. Correlation in stress is the rule. The heat cap is your defence against that correlation.
Fees and slippage discipline
Small edges die from friction. If your average win is near one R and your average loss is near one R you must protect that edge by keeping fees and slippage small. Choose venues with adequate liquidity. Avoid market orders during news bursts. Use limit orders to control entry and exit where practical. Assume a realistic round trip fee in your backtests so that live results match expectations.
Journaling that actually helps
Your journal should capture rules and numbers rather than emotions alone. Use a compact template.
- Setup name and trigger
- Entry price and stop price
- Risk money and unit count
- Reason for the stop placement
- Exit reason and realized R
- Any deviation from the plan
Practice drills to build fluency
Speed matters during live markets. These drills train your sizing reflexes.
Drill one. Percent risk to units
- Account equals twenty thousand
- Risk equals one percent which is two hundred
- Stop distance equals zero point eight
- Units equals two hundred divided by zero point eight which is two hundred fifty units
Drill two. Volatility step change
- Risk equals one hundred fifty
- Stop at two average true range equals three point two which gives forty six units rounded
- If the average true range rises by fifty percent the stop becomes four point eight and units become thirty one rounded
- Loss per trade remains near one hundred fifty
Drill three. Futures or forex conversion
- Risk equals three hundred
- Stop equals twenty ticks
- Tick value equals twelve point five
- Stop distance in money equals two hundred fifty
- Contracts equals three hundred divided by two hundred fifty which is one contract with a small buffer for slippage
Drill four. Heat check
- Four open trades at one percent risk each looks like four percent heat
- If three of them are the same theme treat them as one for heat
- Effective heat is closer to three percent and a new trade in that theme should be deferred
Checklist before every order
- Is the setup valid according to the written rule
- Is the stop defined by structure or by a multiple of the average true range
- Have you measured the stop distance correctly
- Is the risk percent chosen and written on the ticket
- Are units computed from Account times Risk percent divided by Stop distance
- Does the book stay under the heat cap after this order
- Are you in a loss streak that requires reduced size
Common myths to retire
- Myth. Bigger size proves conviction. Reality. Bigger size proves you have abandoned process
- Myth. A tight stop is always better. Reality. A stop that ignores volatility will be hit by noise
- Myth. Averaging down improves price. Reality. Averaging down expands risk without proof that the idea is valid
- Myth. A few big winners will save the month. Reality. A few big losers can end the year
How to adapt across timeframes
The rules above are timeframe agnostic. Shorter timeframes require tighter execution and more attention to fees. Longer timeframes require more patience and a wider cash buffer for gaps. In both cases the math does not change. You measure distance. You set risk money. You compute units. You respect the heat cap. You review in R.
Edge drift and regime change
Edges do not vanish overnight. They drift when the crowd learns the pattern or when macro drivers shift. Your sizing process makes you resilient to drift. Because risk per trade is fixed a flat or negative edge bleeds slowly and gives you time to notice and step back. If you see expectancy in R slide over a thirty or fifty trade sample reduce size and review the rule set before you push the gas again.
Putting it all together
A trader who sizes by feel can enjoy a series of quick gains and then give it back in one week. A trader who sizes by rule can be wrong half the time and still grow steadily. The difference is not superior prediction. The difference is the choice to define loss before entry to respect volatility and to cap heat so a cluster of normal losers does not become a personal crisis.
A compact template you can copy
- Setup name and timeframe
- Entry trigger in one sentence
- Stop rule. Structure or two average true range or another clearly written rule
- Account and risk percent
- Stop distance in price units and in money
- Units computed and rounded to step size
- Heat check across the book and across the theme
- Planned targets in R and exit rules
Bottom line
- Risk per trade must be small and stable
- Stops must respect volatility
- Portfolio heat must remain inside a hard cap
- Review results in R and adjust size after loss streaks
- Let the unit count float with volatility so risk money per trade remains constant
Education
Education and analytics only. Not investment advice. Test every rule with historical data before risking capital. The lesson below is theory with practice drills you can apply to any liquid instrument and any timeframe.
🔻Website: finaur.com/
🔻Blog: finaur.com/blog/
🔻Telegram : t.me/finaur_com/
🔻Trader Psychology Profile – thelumenism.com/
🔻Blog: finaur.com/blog/
🔻Telegram : t.me/finaur_com/
🔻Trader Psychology Profile – thelumenism.com/
Penafian
Maklumat dan penerbitan adalah tidak dimaksudkan untuk menjadi, dan tidak membentuk, nasihat untuk kewangan, pelaburan, perdagangan dan jenis-jenis lain atau cadangan yang dibekalkan atau disahkan oleh TradingView. Baca dengan lebih lanjut di Terma Penggunaan.