$TVC:SHCOMP
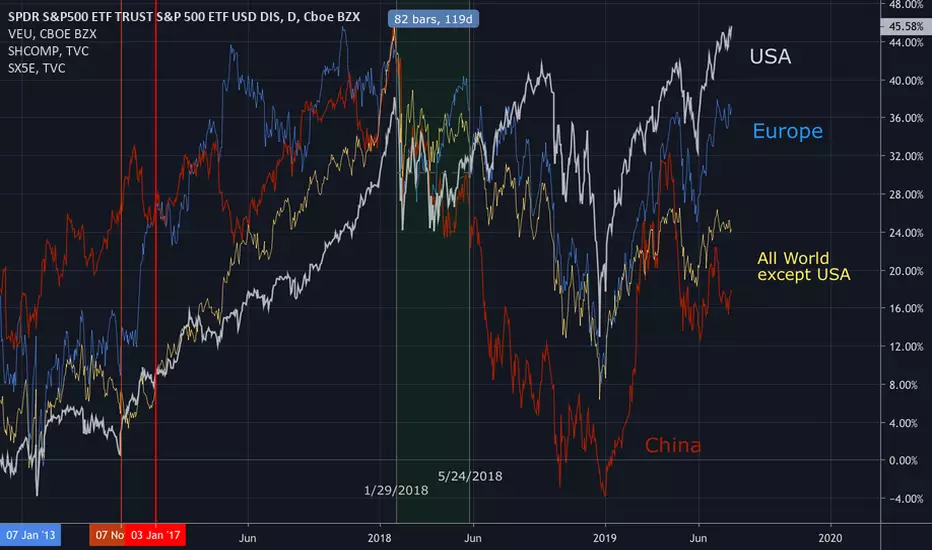
1, Vertical lines: Thin Orange is Trump wins election. Thick Orange is start of Trump presidency
2. Chart Lines:
White is USA stock market, S&P500
Blue is the European “Dow Jones”, Euro Stoxx 50
Orange is the market cap weighted index of the entire planet’s stock markets (the 44 countries with capital markets), except the S&P 500. “All World minus USA” ETF.
Red is China stock market.
Summary:
Between January 29th and May 24th, 2018, The U.S. went from lagging the World’s stock market to clearly leading the Earth’s stock. I propose this is a direct result of the announcement and implementation of Tariffs. 1st with $50B of tariffs on China on March 22nd, 2018.
- I had initially thought this was due to Brexit (Britain exiting the European Union), However, the Brexit vote happened in June 2017, and actually seems to have boosted their markets.
- For symmetry, and to compare apples 2 apples, this chart is in log percentage format.
Penafian
Maklumat dan penerbitan adalah tidak dimaksudkan untuk menjadi, dan tidak membentuk, nasihat untuk kewangan, pelaburan, perdagangan dan jenis-jenis lain atau cadangan yang dibekalkan atau disahkan oleh TradingView. Baca dengan lebih lanjut di Terma Penggunaan.
Penafian
Maklumat dan penerbitan adalah tidak dimaksudkan untuk menjadi, dan tidak membentuk, nasihat untuk kewangan, pelaburan, perdagangan dan jenis-jenis lain atau cadangan yang dibekalkan atau disahkan oleh TradingView. Baca dengan lebih lanjut di Terma Penggunaan.