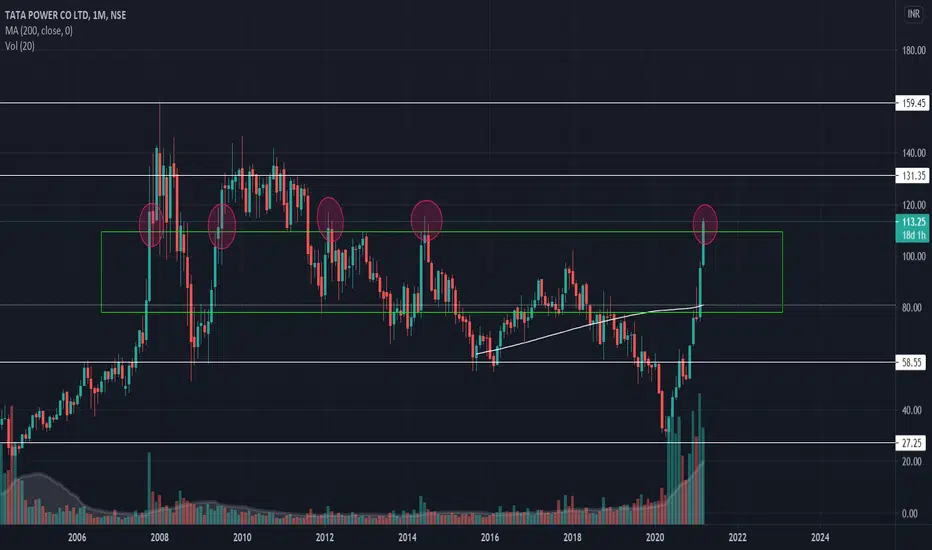
Tata Power Monthly chart Break Out from 2007 range.
Analysis :-
1. 2007 old range break out on the monthly chart.
2. Monthly breakout is really strong.
3. Only things need to see the price action this whole month that it is sustainable or not. And then make Entry.
4. If it's in comes in old range then use buy om dip strategy.
5. Diploy not more than 3% to 5%.
1. 2007 old range break out on the monthly chart.
2. Monthly breakout is really strong.
3. Only things need to see the price action this whole month that it is sustainable or not. And then make Entry.
4. If it's in comes in old range then use buy om dip strategy.
5. Diploy not more than 3% to 5%.
Dagangan aktif
Penafian
Maklumat dan penerbitan adalah tidak bertujuan, dan tidak membentuk, nasihat atau cadangan kewangan, pelaburan, dagangan atau jenis lain yang diberikan atau disahkan oleh TradingView. Baca lebih dalam Terma Penggunaan.
Penafian
Maklumat dan penerbitan adalah tidak bertujuan, dan tidak membentuk, nasihat atau cadangan kewangan, pelaburan, dagangan atau jenis lain yang diberikan atau disahkan oleh TradingView. Baca lebih dalam Terma Penggunaan.