I looked at this on daily and did not see anything except a recent bear flags.
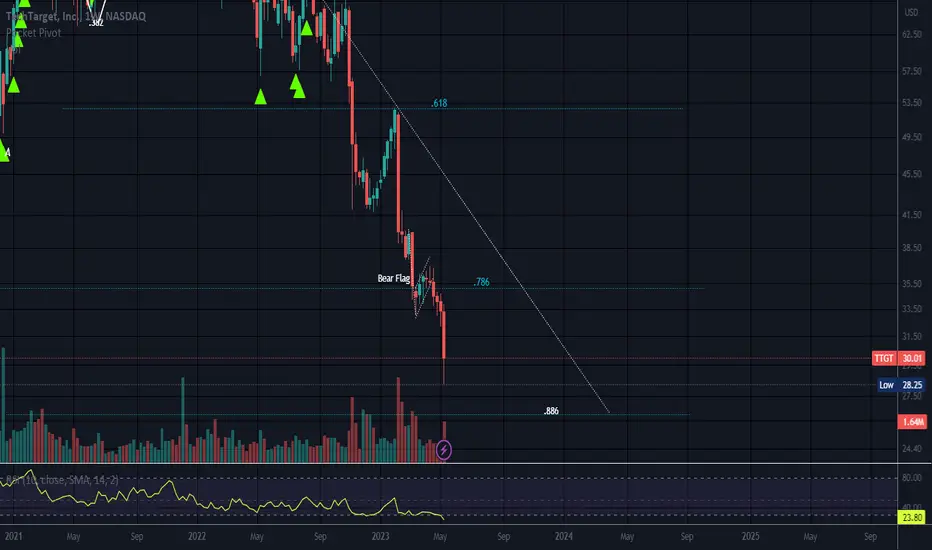
I switched it to the weekly timeframe and I see an M with peak 2 higher than peak 1 so possible Shark. This took a nose dive past the .786 so is not a Cypher.
Sharks terminate at the .886 or the 1.113 on the 4th leg (1.113 would be significantly under $10)
This stock is not receiving any love in this environment but I keep it on my watch list. Some try to pick 10, 20 or even more to watch so they are not overwhelmed b looking at a 100 different stocks. I come to know how the ones on my list perform and I trade them over and over again. This one is on my list even though it may be somewhere over the rainbow before I buy it again. I still check on it here and there.
No recommendation.
Penafian
Maklumat dan penerbitan adalah tidak dimaksudkan untuk menjadi, dan tidak membentuk, nasihat untuk kewangan, pelaburan, perdagangan dan jenis-jenis lain atau cadangan yang dibekalkan atau disahkan oleh TradingView. Baca dengan lebih lanjut di Terma Penggunaan.
Penafian
Maklumat dan penerbitan adalah tidak dimaksudkan untuk menjadi, dan tidak membentuk, nasihat untuk kewangan, pelaburan, perdagangan dan jenis-jenis lain atau cadangan yang dibekalkan atau disahkan oleh TradingView. Baca dengan lebih lanjut di Terma Penggunaan.