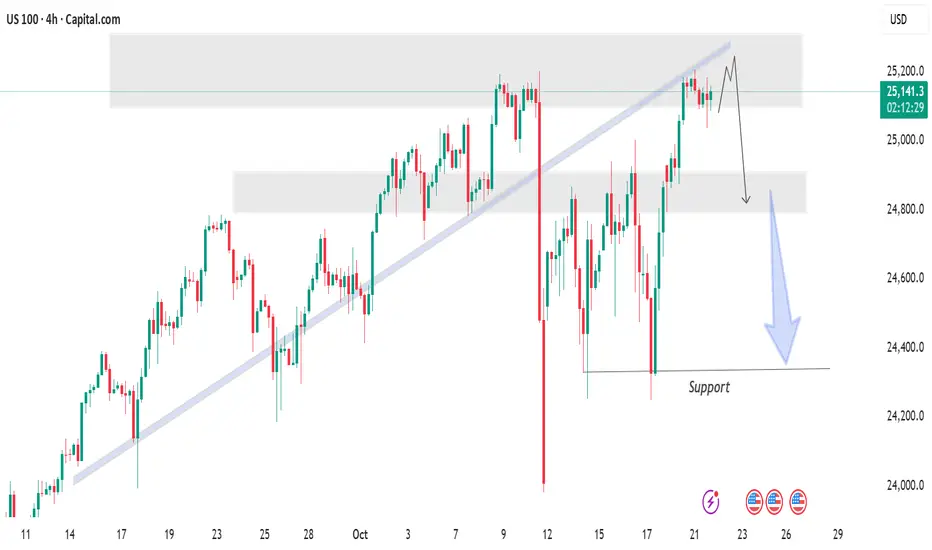
US100 highlights a potential bearish setup forming near a key resistance zone. After a strong recovery toward the 25,150–25,200 region, price action shows signs of rejection at the upper resistance area. The chart illustrates a possible pullback scenario, where the index may retest the 24,800 zone, followed by a deeper move toward the 24,400 support level.
The shaded areas mark supply (resistance) and demand (support) zones, while the trendline break suggests weakening bullish momentum. Overall, the setup signals a potential trend reversal if the price fails to hold above the resistance region.
"Thank you for your support! If you found this idea valuable or learned something new, please consider liking and leaving a comment. I’d really appreciate hearing your feedback and thoughts
Dagangan aktif
Nota
✅FREE FOREX Signals in Telegram
t.me/thedollarpipskiller
✅ Suggest News Channel
t.me/addlist/5h3Y2WG2eyVkOTY0
t.me/thedollarpipskiller
✅ Suggest News Channel
t.me/addlist/5h3Y2WG2eyVkOTY0
Penafian
Maklumat dan penerbitan adalah tidak bertujuan, dan tidak membentuk, nasihat atau cadangan kewangan, pelaburan, dagangan atau jenis lain yang diberikan atau disahkan oleh TradingView. Baca lebih dalam Terma Penggunaan.