The USD/CAD 1-hour chart you provided shows a range-bound market with clear support and resistance levels. Here’s a breakdown of the analysis:
---
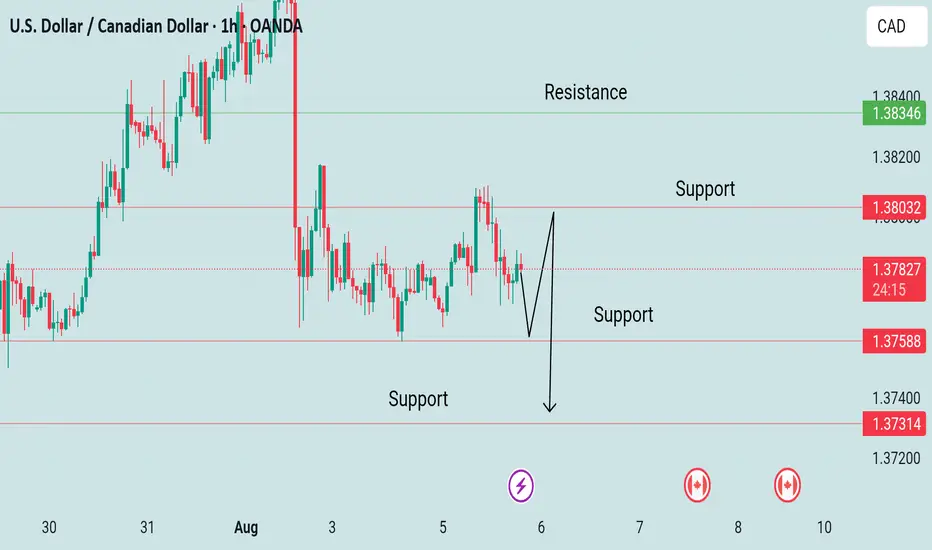
Key Levels:
Resistance: Around 1.38346
Support Zones:
1.38032 (Minor support, now resistance)
1.37588
1.37314 (Stronger support)
---
Current Price:
1.37818, which is in the middle of the current range.
---
Price Action & Pattern:
The chart shows a sideways movement (consolidation) after a downtrend.
There is a drawn projection with two possible scenarios:
1. Bounce from support at 1.37588 → retest of 1.38032
2. Break below 1.37588 → drop to next support at 1.37314
Interpretation
Bullish Scenario
If price bounces from 1.37588, expect a possible move toward 1.38032 or even 1.38346 if bullish momentum builds
Bearish Scenario
If price breaks and closes below 1.37588, we could see a continuation toward 1.37314. A break of that would confirm further downside
Trading Idea
Sell on Breakout:
Below 1.37588, with target 1.37314, and stop above 1.37800
Buy on Bounce
From 1.37588, targeting 1.38032, with stop below 1.37450
Let me know if you want this analysis in Urdu or Sindhi, or need help with a trade setup
---
Key Levels:
Resistance: Around 1.38346
Support Zones:
1.38032 (Minor support, now resistance)
1.37588
1.37314 (Stronger support)
---
Current Price:
1.37818, which is in the middle of the current range.
---
Price Action & Pattern:
The chart shows a sideways movement (consolidation) after a downtrend.
There is a drawn projection with two possible scenarios:
1. Bounce from support at 1.37588 → retest of 1.38032
2. Break below 1.37588 → drop to next support at 1.37314
Interpretation
Bullish Scenario
If price bounces from 1.37588, expect a possible move toward 1.38032 or even 1.38346 if bullish momentum builds
Bearish Scenario
If price breaks and closes below 1.37588, we could see a continuation toward 1.37314. A break of that would confirm further downside
Trading Idea
Sell on Breakout:
Below 1.37588, with target 1.37314, and stop above 1.37800
Buy on Bounce
From 1.37588, targeting 1.38032, with stop below 1.37450
Let me know if you want this analysis in Urdu or Sindhi, or need help with a trade setup
Dagangan aktif
Usdcad sell hit Dagangan ditutup: sasaran tercapai
Usdcad signal sell Target Gold signal
t.me/ProTrader_9
My Channel Link
t.me/ProTrader_9
Check My Performance
t.me/ProTrader_9
My Channel Link
t.me/ProTrader_9
Check My Performance
Penafian
Maklumat dan penerbitan adalah tidak dimaksudkan untuk menjadi, dan tidak membentuk, nasihat untuk kewangan, pelaburan, perdagangan dan jenis-jenis lain atau cadangan yang dibekalkan atau disahkan oleh TradingView. Baca dengan lebih lanjut di Terma Penggunaan.
Gold signal
t.me/ProTrader_9
My Channel Link
t.me/ProTrader_9
Check My Performance
t.me/ProTrader_9
My Channel Link
t.me/ProTrader_9
Check My Performance
Penafian
Maklumat dan penerbitan adalah tidak dimaksudkan untuk menjadi, dan tidak membentuk, nasihat untuk kewangan, pelaburan, perdagangan dan jenis-jenis lain atau cadangan yang dibekalkan atau disahkan oleh TradingView. Baca dengan lebih lanjut di Terma Penggunaan.