Current Price: 1.37706
Timeframe: 4 Hours
Technical Indicators Overview
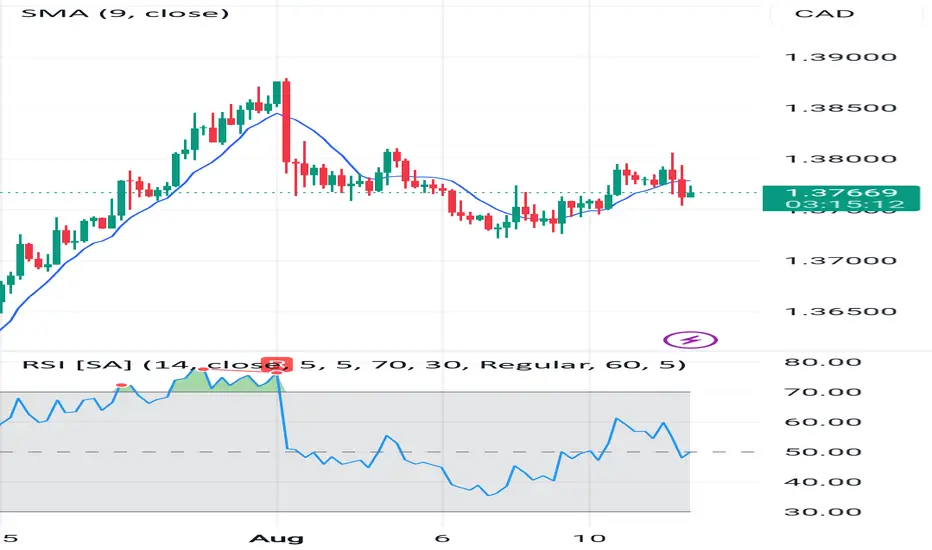
SMA (9-period): Price is hovering around the short-term moving average, signaling indecision in momentum.
RSI (14): Currently near the 50 level, showing a neutral momentum—neither overbought nor oversold.
Key Resistance: 1.3800 – A psychological and technical barrier tested multiple times.
Key Support: 1.3700 – A level where buyers previously stepped in to prevent further decline.
Price Action Summary
USDCAD recently saw a strong bullish move towards the 1.3900 area but quickly reversed, pulling back below the 1.3800 mark. Since then, price action has been choppy, suggesting a tug-of-war between buyers and sellers.
On the 4H chart, the SMA 9 is acting as a dynamic pivot, with candles frequently crossing above and below it. This behavior often precedes a breakout, but direction confirmation is still lacking.
RSI Insights
The RSI remains neutral, around 50, indicating a balance between buying and selling pressures. A move above 60 could invite bullish momentum, while a drop below 40 may trigger further selling.
Potential Scenarios
Bullish Breakout:
If price breaks and closes above 1.3800, the next upside target could be 1.3850–1.3900, where previous highs lie.
Bearish Reversal:
Failure to hold above 1.3750 could open the door for a move towards 1.3700, and below that, 1.3650.
Conclusion
USDCAD is in a consolidation phase, awaiting a catalyst for a decisive breakout. Traders should watch the 1.3800 resistance and 1.3750 support for clues on the next directional move.
Timeframe: 4 Hours
Technical Indicators Overview
SMA (9-period): Price is hovering around the short-term moving average, signaling indecision in momentum.
RSI (14): Currently near the 50 level, showing a neutral momentum—neither overbought nor oversold.
Key Resistance: 1.3800 – A psychological and technical barrier tested multiple times.
Key Support: 1.3700 – A level where buyers previously stepped in to prevent further decline.
Price Action Summary
USDCAD recently saw a strong bullish move towards the 1.3900 area but quickly reversed, pulling back below the 1.3800 mark. Since then, price action has been choppy, suggesting a tug-of-war between buyers and sellers.
On the 4H chart, the SMA 9 is acting as a dynamic pivot, with candles frequently crossing above and below it. This behavior often precedes a breakout, but direction confirmation is still lacking.
RSI Insights
The RSI remains neutral, around 50, indicating a balance between buying and selling pressures. A move above 60 could invite bullish momentum, while a drop below 40 may trigger further selling.
Potential Scenarios
Bullish Breakout:
If price breaks and closes above 1.3800, the next upside target could be 1.3850–1.3900, where previous highs lie.
Bearish Reversal:
Failure to hold above 1.3750 could open the door for a move towards 1.3700, and below that, 1.3650.
Conclusion
USDCAD is in a consolidation phase, awaiting a catalyst for a decisive breakout. Traders should watch the 1.3800 resistance and 1.3750 support for clues on the next directional move.
Penafian
Maklumat dan penerbitan adalah tidak dimaksudkan untuk menjadi, dan tidak membentuk, nasihat untuk kewangan, pelaburan, perdagangan dan jenis-jenis lain atau cadangan yang dibekalkan atau disahkan oleh TradingView. Baca dengan lebih lanjut di Terma Penggunaan.
Penafian
Maklumat dan penerbitan adalah tidak dimaksudkan untuk menjadi, dan tidak membentuk, nasihat untuk kewangan, pelaburan, perdagangan dan jenis-jenis lain atau cadangan yang dibekalkan atau disahkan oleh TradingView. Baca dengan lebih lanjut di Terma Penggunaan.