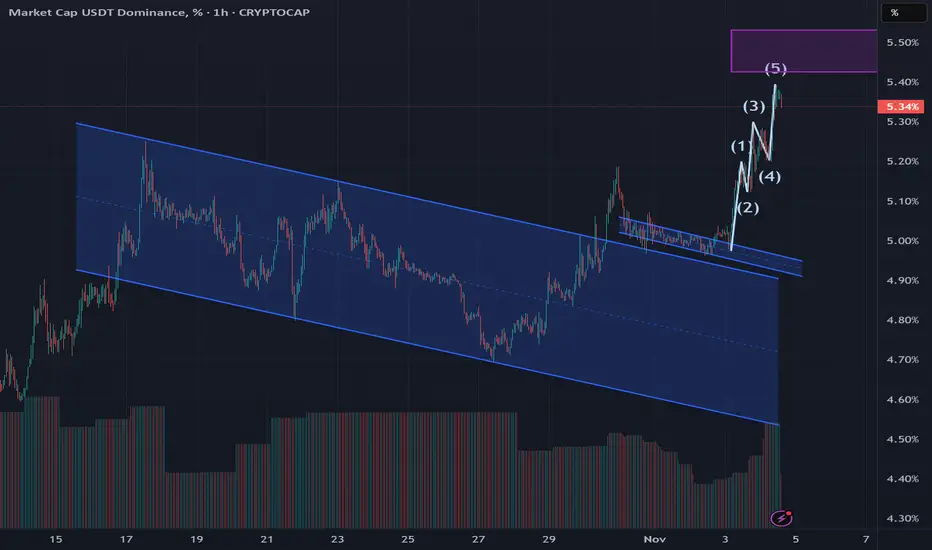
On the USDT dominance chart, two bullish flags clearly formed and were fulfilled
Following this, a five-wave Elliott wave formed at the breakout. The length of the five waves almost matches the height of the flagpole from the larger bullish flag, meaning there's a chance we could reach the purple area, and only then will corrective waves form
As is well known, when USDT dominance rises, the price of BTC falls, and vice versa, when USDT dominance falls, the price of BTC rises
More detailed analysis, additional charts, and key levels to watch are available on our site
Penafian
Maklumat dan penerbitan adalah tidak bertujuan, dan tidak membentuk, nasihat atau cadangan kewangan, pelaburan, dagangan atau jenis lain yang diberikan atau disahkan oleh TradingView. Baca lebih dalam Terma Penggunaan.
Penafian
Maklumat dan penerbitan adalah tidak bertujuan, dan tidak membentuk, nasihat atau cadangan kewangan, pelaburan, dagangan atau jenis lain yang diberikan atau disahkan oleh TradingView. Baca lebih dalam Terma Penggunaan.