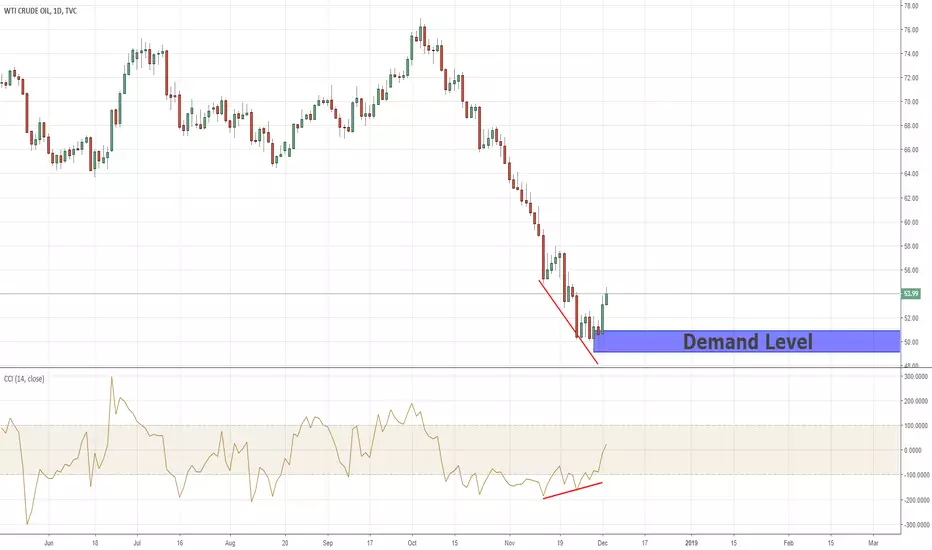
As we can see, the CCI indicator shows a clear divergence between the price lows and the indicator lows,
as the price create a lower low the CCI shows higher low, this kind of Divergence indicates this bearish momentum is losing power and there is a good chance the momentum will change to bullish, we can see the divergence by the trend line I marked on The CCI and the price. I always prefer to integrate between indicators and price action, especially with Supply & Demand, therefore, I'll wait for the price to return the demand below, if that happens, I'll buy at this demand and my target will be 64.00 zones.
as the price create a lower low the CCI shows higher low, this kind of Divergence indicates this bearish momentum is losing power and there is a good chance the momentum will change to bullish, we can see the divergence by the trend line I marked on The CCI and the price. I always prefer to integrate between indicators and price action, especially with Supply & Demand, therefore, I'll wait for the price to return the demand below, if that happens, I'll buy at this demand and my target will be 64.00 zones.
The5ers Funding Forex Traders & Growth Program. Get Funded with up to $2.56M
We Trade Forex - Come Join Us!
the5ers.com
We Trade Forex - Come Join Us!
the5ers.com
Penafian
Maklumat dan penerbitan adalah tidak dimaksudkan untuk menjadi, dan tidak membentuk, nasihat untuk kewangan, pelaburan, perdagangan dan jenis-jenis lain atau cadangan yang dibekalkan atau disahkan oleh TradingView. Baca dengan lebih lanjut di Terma Penggunaan.