As of April 29, 2025, here are the key 4-hour support and resistance levels for Wipro Ltd (NSE: WIPRO) based on recent technical analyses:
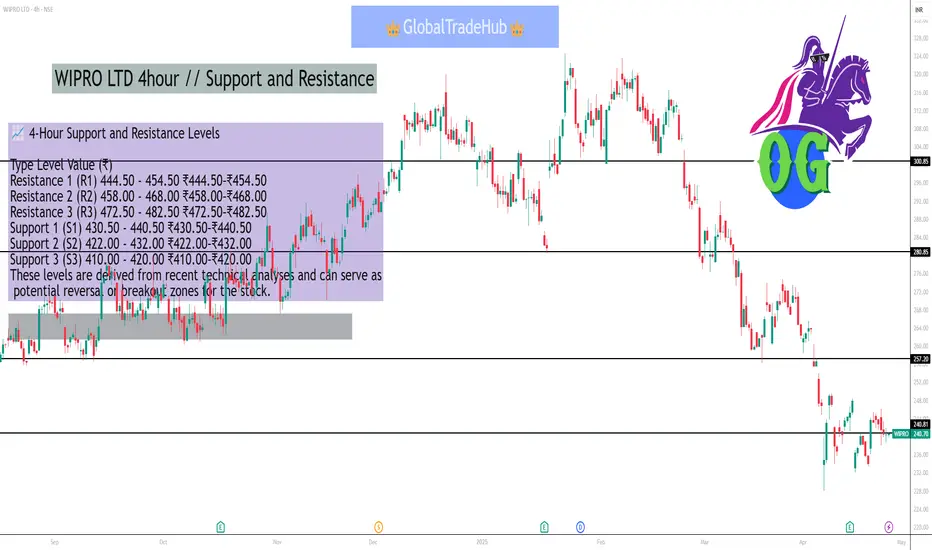
📈 4-Hour Support and Resistance Levels
Type Level Value (₹)
Resistance 1 (R1) 444.50 - 454.50 ₹444.50–₹454.50
Resistance 2 (R2) 458.00 - 468.00 ₹458.00–₹468.00
Resistance 3 (R3) 472.50 - 482.50 ₹472.50–₹482.50
Support 1 (S1) 430.50 - 440.50 ₹430.50–₹440.50
Support 2 (S2) 422.00 - 432.00 ₹422.00–₹432.00
Support 3 (S3) 410.00 - 420.00 ₹410.00–₹420.00
These levels are derived from recent technical analyses and can serve as potential reversal or breakout zones for the stock.
📊 Additional Technical Indicators
Relative Strength Index (RSI): Approximately 60, indicating a neutral to slightly bullish momentum.
Moving Average Convergence Divergence (MACD): Currently in a bearish crossover, suggesting potential downward pressure.
Bollinger Bands: The stock is trading above the upper band, indicating high volatility and potential overbought conditions.
📌 Key Observations
Resistance Levels: If Wipro breaks above ₹444.50, it may face resistance at ₹458.00 and ₹472.50.
Support Levels: A decline below ₹430.50 could lead to further support at ₹422.00 and ₹410.00.
Trend Analysis: The stock is currently testing the upper resistance zone. A breakout above ₹444.50 could signal a continuation of the upward trend. Conversely, a drop below ₹430.50 may indicate a bearish reversal.
Please note that these levels are based on historical data and technical analysis, and actual market conditions may vary. It's advisable to conduct further research or consult with a financial advisor before making investment decisions.
Penerbitan berkaitan
Penafian
Maklumat dan penerbitan adalah tidak dimaksudkan untuk menjadi, dan tidak membentuk, nasihat untuk kewangan, pelaburan, perdagangan dan jenis-jenis lain atau cadangan yang dibekalkan atau disahkan oleh TradingView. Baca dengan lebih lanjut di Terma Penggunaan.
Penerbitan berkaitan
Penafian
Maklumat dan penerbitan adalah tidak dimaksudkan untuk menjadi, dan tidak membentuk, nasihat untuk kewangan, pelaburan, perdagangan dan jenis-jenis lain atau cadangan yang dibekalkan atau disahkan oleh TradingView. Baca dengan lebih lanjut di Terma Penggunaan.