🔍 Technical Overview
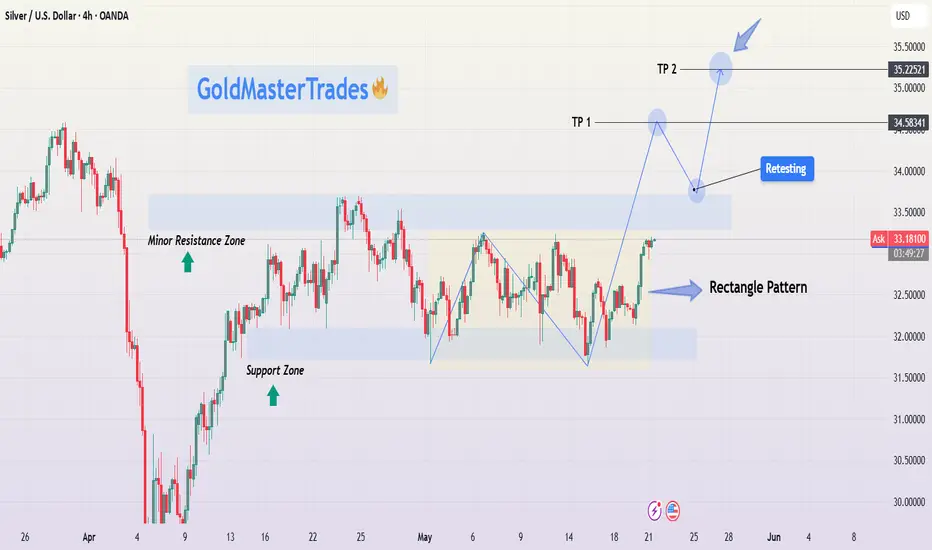
Silver has been forming a textbook rectangle consolidation pattern over the past few weeks, bouncing between a clearly defined Support Zone (~$32.10) and Resistance Zone (~$33.40). This range-bound movement indicates accumulation, a phase where smart money typically builds positions before initiating a directional breakout.
Currently, price action shows a breakout attempt toward the upper resistance. If momentum continues, we could see a bullish breakout, followed by a potential retest of the broken resistance (now support). A successful retest would confirm a high-probability setup for a move to higher targets.
📌 Key Technical Zones
Support Zone: ~$32.10
This level has been tested multiple times, with price consistently bouncing higher, signaling strong buyer interest.
Minor Resistance Zone: ~$33.00
Acted as an intermediate ceiling within the rectangle. Once broken, this level became a signpost for bullish continuation.
Main Resistance Zone: ~$33.40
The top boundary of the rectangle; this is the key breakout level.
Target 1 (TP1): $34.58
A logical resistance level based on previous price structure and breakout projection.
Target 2 (TP2): $35.22
A more extended target derived from the height of the rectangle pattern projected from the breakout point (measured move).
⚙️ Price Action Insights
Rectangle Pattern Behavior: Price ranged within horizontal support/resistance, forming consistent highs and lows — a strong signal of accumulation.
Momentum Shift: Recent bullish candles and higher lows suggest buying pressure is increasing.
Breakout in Progress: Price is currently pushing above the upper rectangle boundary. A confirmed breakout candle close followed by a retest would provide a higher-probability entry opportunity.
Retest Strategy: Retests are critical for confirmation. A pullback to ~$33.40 with rejection signals (e.g., bullish engulfing, pin bar) would strengthen the case for further upside.
🧠 Mindset & Strategy Explanation
This setup represents patience, structure, and discipline in trading:
✅ Wait for the Pattern: Rectangle patterns often trap impatient traders. Waiting for a confirmed breakout and retest gives higher-quality entries.
✅ Risk Management is Key: Use the structure of the rectangle to define risk. Stops should be set just below the last swing low or inside the range.
✅ Targeting with Precision: TP1 and TP2 are not random — they’re derived from prior resistance levels and pattern projections. This keeps your trading logical, not emotional.
✅ Mind Over Market: Don’t chase breakouts. Wait for confirmation. The retest is often your friend in swing trading setups like this.
📋 Trade Idea (Not Financial Advice)
📍 Entry: On confirmed breakout above $33.40 or retest of this level with bullish confirmation.
🎯 Target 1: $34.58 (partial take profit suggested)
🎯 Target 2: $35.22 (measured move projection)
🛑 Stop Loss: Below $32.70 (under recent support structure)
🔁 Optional: Trail stop loss after TP1 to lock in profits as TP2 approaches.
🧠 Final Thoughts for Traders
This chart provides a clean example of how price consolidates before expansion. The rectangle pattern allows for easy identification of entry/exit zones and offers a solid risk-to-reward setup. Whether you're a new trader learning to spot consolidation patterns or a seasoned pro looking for low-risk, high-reward setups — this XAGUSD formation is one to watch.
Keep an eye on volume and candle structure around the breakout zone. Confirmation is key. Discipline is everything.
Penerbitan berkaitan
Penafian
The information and publications are not meant to be, and do not constitute, financial, investment, trading, or other types of advice or recommendations supplied or endorsed by TradingView. Read more in the Terms of Use.
Penerbitan berkaitan
Penafian
The information and publications are not meant to be, and do not constitute, financial, investment, trading, or other types of advice or recommendations supplied or endorsed by TradingView. Read more in the Terms of Use.