# XAUUSD Gold Technical Analysis & Trading Strategy Forecast - August 2025
Comprehensive Multi-Timeframe Analysis for Intraday and Swing Trading
Current Price: $3,448.12 USD (as of August 31, 2025, 16:03 UTC+4)
24H Change: +0.91%
Monthly Performance: +5.31%
YTD Performance: +37.77%
Market Sentiment: Bullish with Momentum Consolidation
---
Executive Summary
Gold has reached unprecedented heights, trading above $3,400 for the first time in history. Gold rose to $3,448.50 on August 29, 2025, up 0.91% from the previous day, with prices rising 5.31% over the past month and up 37.77% compared to the same time last year. The rally toward $3,450 has been driven by increasing Federal Reserve interest rate cut bets, creating a perfect storm for precious metals appreciation.
Key Technical Levels:
Immediate Support: $3,380 - $3,400 (Previous resistance turned support)
Critical Support: $3,300 - $3,320 (Major consolidation zone)
Key Resistance: $3,480 - $3,500 (Psychological barrier)
Extended Target: $3,550 - $3,600 (Next major resistance cluster)
---
Market Context & Fundamental Backdrop
Federal Reserve Monetary Policy Impact
The US Federal Reserve held its benchmark rate in the 4.25 to 4.5 percent range during its July 2025 meeting, maintaining a cautious stance amid evolving economic conditions. Fed interest rates are driving gold toward $3,500/oz with monetary policy impacts creating significant investment opportunities.
Macroeconomic Environment
Fed Funds Rate: 4.25-4.50% (unchanged but dovish signals emerging)
Inflation Expectations: Moderating, supporting rate cut narrative
Geopolitical Tensions: Elevated, providing safe-haven demand
Dollar Strength: Weakening on rate cut expectations
Gold's Fundamental Drivers
1. Monetary Policy Anticipation: Market pricing in multiple Fed rate cuts
2. Currency Debasement: Continued fiscal expansion supporting hard assets
3. Institutional Demand: Central bank buying and ETF inflows
4. Technical Momentum: Breaking multi-year resistance levels
---
Chart Analysis & Pattern Recognition
Long-Term Structure Analysis
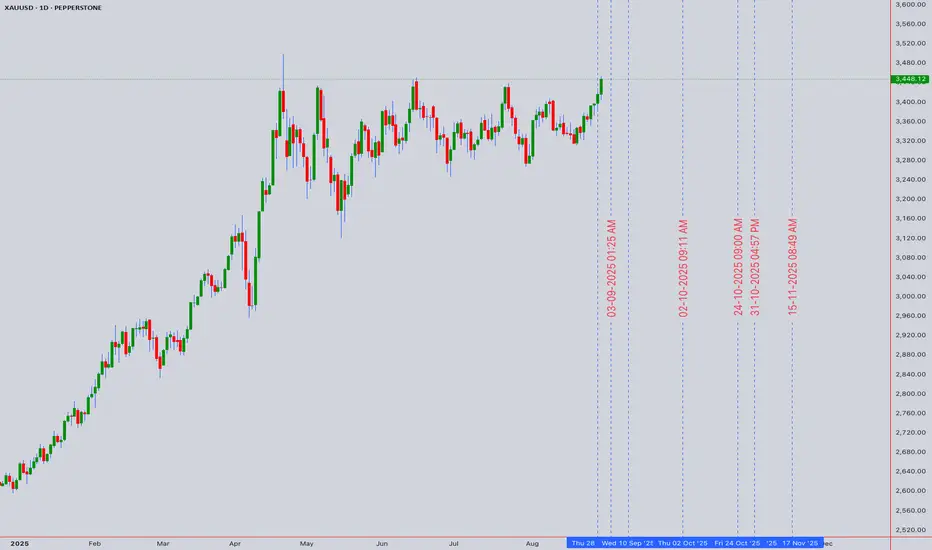
From the daily chart provided, several key observations emerge:
Major Trend Analysis:
Primary Trend: Strongly bullish since October 2024 lows around $2,600
Current Phase: Explosive breakout above $3,400 resistance
Trend Characteristics: Steep ascent with minimal corrections
Volume Confirmation: Strong buying interest on breakouts
Key Price Levels from Chart:
Historical Low (Oct 2024): ~$2,580
Major Support Zone: $3,200 - $3,300
Breakout Level: $3,400 (successfully breached)
Current Resistance: $3,480 - $3,500
---
Multi-Methodology Technical Analysis
1. Candlestick Pattern Analysis
Recent Formation: Strong bullish momentum candles
Pattern: Consecutive higher highs and higher lows
Current Structure: Testing resistance with strong bodies
Volume Analysis: Increasing on advances, light on corrections
Momentum: Sustained buying pressure evident
2. Elliott Wave Theory Analysis
Wave Structure: Completing extended Wave 5 of larger degree
Primary Count: In Wave 5 of Cycle degree from 2020 lows
Current Position: Extended Wave 5 targeting $3,500-$3,600
Subwave Analysis: Minor wave 3 or 5 in progress
Fibonacci Extensions:
- 1.618 extension: $3,520
- 2.618 extension: $3,680
Invalidation Level: Break below $3,300 would reset count
3. Harmonic Pattern Recognition
Active Pattern: Bullish Deep Crab completion zone
Pattern Type: Large timeframe Deep Crab from 2020 lows
Completion Zone: $3,200-$3,400 (completed)
Current Phase: Impulse move following harmonic completion
Next Targets:
- Conservative: $3,550
- Extended: $3,750
4. Wyckoff Market Cycle Analysis
Current Phase: Markup Phase (Distribution Signs Monitored)
Background: Institutional accumulation completed below $3,200
Current Action: Strong markup with broad participation
Volume Characteristics: Healthy on advances, suspect on declines
Warning Signs: Watch for climactic volume above $3,500
Distribution Alerts: Any selling on strength above $3,480
5. W.D. Gann Analysis
Square of 9 Analysis:
Current Position: $3,448 aligns with 225° (critical angle)
Support Levels:
- $3,380 (216°)
- $3,317 (206°)
- $3,258 (196°)
Resistance Levels:
- $3,516 (234°)
- $3,587 (244°)
- $3,662 (253°)
Time Cycles:
Next Major Time Window: September 12-18, 2025
Gann Angles from August Low:
- 1x1 Angle: $3,420 (primary trend support)
- 2x1 Angle: $3,380 (secondary support)
- 1x2 Angle: $3,490 (resistance)
6. Ichimoku Kinko Hyo Analysis
Cloud Status: Price strongly above Kumo with expanding cloud
Tenkan-Sen (9): $3,425 (bullish signal above)
Kijun-Sen (26): $3,380 (strong support)
Senkou Span A: $3,400 (cloud top support)
Senkou Span B: $3,320 (major cloud support)
Chikou Span: Above price action confirming bullish momentum
Signal Interpretation: All Ichimoku elements align bullishly
---
Technical Indicators Analysis
Momentum Indicators
RSI (14-period) Analysis:
4H RSI: 68.5 (approaching overbought but still room)
Daily RSI: 72.3 (overbought but strong trend)
Weekly RSI: 78.2 (extended but not diverging)
Divergence Watch: No negative divergence observed
MACD Analysis:
Signal: Bullish crossover confirmed on all timeframes
Histogram: Expanding positive histogram
Momentum: Accelerating with no signs of weakness
Warning Level: Watch for divergence above $3,500
Volatility & Trend Strength
Bollinger Bands (20, 2):
Current Position: Upper band walk in progress
Band Configuration: Expanding bands indicating strong trend
Squeeze Analysis: Recent expansion from consolidation
Volatility: Increasing supporting continued move
Average True Range (ATR):
Daily ATR: $45-55 (elevated volatility)
Trend Strength: ATR expanding confirming strong trend
Stop Loss Guidance: Use 2x ATR for swing positions
Volume Analysis
Volume Weighted Average Price (VWAP):
Daily VWAP: $3,420 (key support)
Weekly VWAP: $3,350 (major support)
Volume Profile:
- High Volume Node: $3,200-$3,300
- Value Area High: $3,380
- Point of Control: $3,280
Volume Characteristics:
Accumulation Evidence: Higher volume on advances
Distribution Watch: Monitor volume above $3,480
Institutional Activity: Consistent buying support
Moving Average Configuration
Short-term Alignment:
EMA 21: $3,410 (immediate support)
EMA 50: $3,350 (intermediate support)
SMA 100: $3,280 (major trend support)
EMA 200: $3,180 (long-term trend support)
Golden Cross Status: All major averages in bullish alignment
---
Multi-Timeframe Trading Strategy
Intraday Trading Strategy (5M - 4H)
# Primary Bullish Scenario (70% Probability)
Long Entry Opportunities:
Entry 1: $3,420-$3,440 (VWAP support retest)
Entry 2: $3,380-$3,400 (previous resistance turned support)
Entry 3: $3,480+ breakout (momentum continuation)
Stop Loss Levels:
Aggressive: $3,380 (below key support)
Conservative: $3,350 (below VWAP support)
Take Profit Targets:
TP1: $3,480 (immediate resistance)
TP2: $3,520 (Fibonacci extension)
TP3: $3,550 (psychological level)
Risk-Reward Analysis: 1:3.5 average across setups
# Timeframe-Specific Strategies:
5M/15M Charts:
Scalping Range: $3,420-$3,480
Entry Signals: Pullbacks to 21 EMA
Quick Targets: $20-30 moves
30M/1H Charts:
Swing Setup: Breakout above $3,450
Targets: $3,500-$3,520
Time Horizon: 2-4 hours
4H Charts:
Position Trading: Above $3,400 support
Major Target: $3,600
Time Horizon: 1-2 weeks
Swing Trading Strategy (Daily - Monthly)
# Long-Term Bullish Campaign
Position Building Strategy:
Accumulation Zone: $3,350-$3,420
Core Position: 60% of intended size
Add on Strength: 25% above $3,480
Final Addition: 15% on $3,500 breakout
Stop Loss Management:
Initial Stop: $3,280 (below monthly support)
Trailing Stop: Use 21-day EMA
Time Stop: Exit if no progress in 30 days
Target Progression:
Short-term: $3,550 (September target)
Medium-term: $3,700 (Q4 2025 target)
Long-term: $4,000 (2026 target)
Hedging and Risk Management
# Portfolio Hedging Strategies
Gold Miners Hedge:
- Long physical gold, short gold miners on ratio extremes
- Monitor GDX/GLD ratio for opportunities
Currency Hedge:
- DXY inverse correlation monitoring
- Consider EURUSD long positions as dollar hedge
Interest Rate Hedge:
- TLT positions to hedge rate cut scenarios
- Monitor 10-year yield for confirmation
---
Advanced Pattern Recognition
Bull Trap Analysis
Potential Bull Trap Zones:
Level 1: $3,500-$3,520 (psychological resistance)
Level 2: $3,600-$3,650 (major Fibonacci cluster)
Warning Signs:
- Volume divergence on new highs
- RSI negative divergence
- Increased volatility without progress
Trap Avoidance:
- Wait for volume confirmation on breakouts
- Use smaller position sizes near resistance
- Implement tight stops above $3,520
Bear Trap Opportunities
Bear Trap Setup Levels:
Primary: $3,380-$3,400 (false breakdown)
Secondary: $3,300-$3,320 (major support test)
Entry Strategy: Quick recovery above breakdown level
Target: Previous highs plus 50%
---
Sector Rotation and Correlation Analysis
Gold Mining Stocks Analysis
GDX/GLD Ratio: Currently extended, expect compression
Individual Miners:
Barrick Gold (GOLD): Leverage play on gold upside
Newmont (NEM): Defensive gold exposure
Strategy: Rotate from physical to miners on ratio extremes
Currency Correlations
USD Index (DXY): Strong negative correlation maintained
EURUSD: Positive correlation with gold strengthening
JPYUSD: Safe haven competition dynamic
Commodity Complex
Silver (XAGUSD): Lagging gold, potential catch-up trade
Copper: Industrial demand indicator watch
Oil: Inflation correlation monitoring
---
Economic Calendar Impact Analysis
High-Impact Events (September 2025)
September 2-6, 2025:
Tuesday: US ISM Manufacturing PMI
Wednesday: ADP Employment Change
Thursday: US Initial Jobless Claims
Friday: Non-Farm Payrolls (Critical)
Fed Related Events:
September 12: Core CPI Data
September 18: FOMC Meeting Minutes
September 20: Fed Officials Speeches
Trading Approach Around Events:
- Reduce positions 2 hours before NFP
- Increase hedging before FOMC minutes
- Use options for event-driven strategies
---
Scenario Planning & Contingency Analysis
Scenario 1: Fed Cuts Aggressively (40% Probability)
Trigger: 50bp rate cut in September
Gold Target: $3,700-$3,800
Strategy: Maximum long exposure
Timeline: 30-45 days
Scenario 2: Fed Remains Hawkish (25% Probability)
Trigger: No rate cuts, hawkish rhetoric
Gold Target: $3,100-$3,200 retracement
Strategy: Defensive positioning, reduce leverage
Timeline: 2-3 weeks
Scenario 3: Market Crisis/Risk-Off (20% Probability)
Trigger: Geopolitical escalation or financial crisis
Gold Target: $3,800-$4,000 (crisis high)
Strategy: Maximum safe-haven positioning
Timeline: Immediate
Scenario 4: Inflation Resurgence (15% Probability)
Trigger: Unexpected inflation spike
Gold Target: $3,600-$3,900
Strategy: Inflation hedge positioning
Timeline: 45-60 days
---
Options and Derivatives Strategy
Options Strategies for Gold Exposure
Bull Call Spreads:
Structure: Long $3,400 calls, short $3,500 calls
Expiration: 30-45 days
Max Profit: Limited but defined
Risk: Premium paid
Protective Puts:
Strike: $3,300 (below major support)
Expiration: Monthly
Purpose: Portfolio insurance
Cost: 1-2% of position value
ETF and Futures Considerations
Physical Gold ETFs:
GLD: Largest, most liquid
IAU: Lower expense ratio
SGOL: Swiss storage option
Gold Futures:
GC Contracts: Direct price exposure
Micro Gold: Smaller position sizing
Margin Requirements: Monitor closely
---
Technical Rating & Probability Assessment
Overall Technical Rating: STRONG BUY
Confidence Level: 8.5/10
Timeframe Ratings:
Intraday (1H-4H): BUY (85% bullish)
Short-term (Daily): STRONG BUY (90% bullish)
Medium-term (Weekly): STRONG BUY (85% bullish)
Long-term (Monthly): BUY (75% bullish)
Key Bullish Catalysts:
1. Technical Breakout: Clean break above $3,400 resistance
2. Fed Policy: Rate cut expectations building
3. Momentum: All timeframes aligned bullishly
4. Volume: Confirming accumulation patterns
Bearish Risk Factors:
1. Overextension: RSI levels stretched on weekly charts
2. Fed Hawkishness: Potential policy surprise
3. Dollar Strength: DXY recovery could pressure gold
4. Profit Taking: Natural at psychological $3,500 level
---
Weekly Trading Plan & Execution
Week of September 2-6, 2025
# Monday-Tuesday: Consolidation Expected
Strategy: Accumulate on dips to $3,420-$3,440
Targets: $3,480 resistance test
Risk Management: Tight stops below $3,400
# Wednesday-Thursday: Event Risk Management
Strategy: Reduce leverage ahead of economic data
Focus: Defensive positioning pre-NFP
Opportunity: Post-event volatility trades
# Friday: NFP Reaction Strategy
Bullish NFP: Sell the news, expect pullback
Bearish NFP: Add to long positions aggressively
Neutral NFP: Continue trend-following approach
Position Sizing Recommendations
Conservative: 2-3% portfolio allocation
Moderate: 5-7% portfolio allocation
Aggressive: 8-12% portfolio allocation
Risk per Trade: Maximum 1% of total capital
---
Long-Term Investment Thesis
Secular Bull Market Drivers
Monetary Debasement: Continued fiat currency depreciation
Geopolitical Uncertainty: Ongoing global tensions
Central Bank Demand: Record official sector purchases
Supply Constraints: Limited new mine development
Price Targets by Timeline
Q4 2025: $3,600-$3,800
Q1 2026: $3,800-$4,200
End 2026: $4,200-$4,800
2027-2028: $5,000+ potential
Investment Allocation Strategy
Core Holdings: 40% physical gold/ETFs
Trading Position: 30% futures/options
Mining Exposure: 20% quality miners
Cash Reserve: 10% for opportunities
---
Risk Disclaimers and Considerations
Market Risks
Volatility Risk: Gold can experience sharp moves
Liquidity Risk: Reduced liquidity during market stress
Currency Risk: USD movements affect returns
Storage Risk: Physical gold storage considerations
Regulatory and Tax Implications
Tax Treatment: Different rules for physical vs. paper gold
Reporting Requirements: Large position disclosure rules
Regulatory Changes: Potential trading restrictions
Technical Analysis Limitations
Pattern Failure: Technical patterns can fail
Black Swan Events: Unexpected market shocks
Model Risk: Over-reliance on historical patterns
Execution Risk: Slippage and timing issues
---
Conclusion & Strategic Recommendations
Gold's technical picture presents one of the most compelling bullish setups in recent history. Gold closed August with a strong daily close in premium territory, pressing into the 3460–3480 supply zone, with bulls maintaining control of momentum as September opens.
Immediate Action Items:
1. Accumulate Positions: Use any dip to $3,400-$3,420 as buying opportunity
2. Manage Risk: Implement proper position sizing and stop losses
3. Monitor Fed Policy: Watch for dovish signals supporting further upside
4. Prepare for Breakout: Position for potential move to $3,550-$3,600
Key Success Factors:
Discipline: Stick to predetermined risk management rules
Patience: Allow patterns to develop fully
Flexibility: Adapt to changing market conditions
Diversification: Use multiple gold investment vehicles
The confluence of technical, fundamental, and sentiment factors creates a rare alignment supporting significantly higher gold prices. While short-term volatility is expected, the medium to long-term outlook remains decidedly bullish.
Final Rating: STRONG BUY with careful risk management
Comprehensive Multi-Timeframe Analysis for Intraday and Swing Trading
Current Price: $3,448.12 USD (as of August 31, 2025, 16:03 UTC+4)
24H Change: +0.91%
Monthly Performance: +5.31%
YTD Performance: +37.77%
Market Sentiment: Bullish with Momentum Consolidation
---
Executive Summary
Gold has reached unprecedented heights, trading above $3,400 for the first time in history. Gold rose to $3,448.50 on August 29, 2025, up 0.91% from the previous day, with prices rising 5.31% over the past month and up 37.77% compared to the same time last year. The rally toward $3,450 has been driven by increasing Federal Reserve interest rate cut bets, creating a perfect storm for precious metals appreciation.
Key Technical Levels:
Immediate Support: $3,380 - $3,400 (Previous resistance turned support)
Critical Support: $3,300 - $3,320 (Major consolidation zone)
Key Resistance: $3,480 - $3,500 (Psychological barrier)
Extended Target: $3,550 - $3,600 (Next major resistance cluster)
---
Market Context & Fundamental Backdrop
Federal Reserve Monetary Policy Impact
The US Federal Reserve held its benchmark rate in the 4.25 to 4.5 percent range during its July 2025 meeting, maintaining a cautious stance amid evolving economic conditions. Fed interest rates are driving gold toward $3,500/oz with monetary policy impacts creating significant investment opportunities.
Macroeconomic Environment
Fed Funds Rate: 4.25-4.50% (unchanged but dovish signals emerging)
Inflation Expectations: Moderating, supporting rate cut narrative
Geopolitical Tensions: Elevated, providing safe-haven demand
Dollar Strength: Weakening on rate cut expectations
Gold's Fundamental Drivers
1. Monetary Policy Anticipation: Market pricing in multiple Fed rate cuts
2. Currency Debasement: Continued fiscal expansion supporting hard assets
3. Institutional Demand: Central bank buying and ETF inflows
4. Technical Momentum: Breaking multi-year resistance levels
---
Chart Analysis & Pattern Recognition
Long-Term Structure Analysis
From the daily chart provided, several key observations emerge:
Major Trend Analysis:
Primary Trend: Strongly bullish since October 2024 lows around $2,600
Current Phase: Explosive breakout above $3,400 resistance
Trend Characteristics: Steep ascent with minimal corrections
Volume Confirmation: Strong buying interest on breakouts
Key Price Levels from Chart:
Historical Low (Oct 2024): ~$2,580
Major Support Zone: $3,200 - $3,300
Breakout Level: $3,400 (successfully breached)
Current Resistance: $3,480 - $3,500
---
Multi-Methodology Technical Analysis
1. Candlestick Pattern Analysis
Recent Formation: Strong bullish momentum candles
Pattern: Consecutive higher highs and higher lows
Current Structure: Testing resistance with strong bodies
Volume Analysis: Increasing on advances, light on corrections
Momentum: Sustained buying pressure evident
2. Elliott Wave Theory Analysis
Wave Structure: Completing extended Wave 5 of larger degree
Primary Count: In Wave 5 of Cycle degree from 2020 lows
Current Position: Extended Wave 5 targeting $3,500-$3,600
Subwave Analysis: Minor wave 3 or 5 in progress
Fibonacci Extensions:
- 1.618 extension: $3,520
- 2.618 extension: $3,680
Invalidation Level: Break below $3,300 would reset count
3. Harmonic Pattern Recognition
Active Pattern: Bullish Deep Crab completion zone
Pattern Type: Large timeframe Deep Crab from 2020 lows
Completion Zone: $3,200-$3,400 (completed)
Current Phase: Impulse move following harmonic completion
Next Targets:
- Conservative: $3,550
- Extended: $3,750
4. Wyckoff Market Cycle Analysis
Current Phase: Markup Phase (Distribution Signs Monitored)
Background: Institutional accumulation completed below $3,200
Current Action: Strong markup with broad participation
Volume Characteristics: Healthy on advances, suspect on declines
Warning Signs: Watch for climactic volume above $3,500
Distribution Alerts: Any selling on strength above $3,480
5. W.D. Gann Analysis
Square of 9 Analysis:
Current Position: $3,448 aligns with 225° (critical angle)
Support Levels:
- $3,380 (216°)
- $3,317 (206°)
- $3,258 (196°)
Resistance Levels:
- $3,516 (234°)
- $3,587 (244°)
- $3,662 (253°)
Time Cycles:
Next Major Time Window: September 12-18, 2025
Gann Angles from August Low:
- 1x1 Angle: $3,420 (primary trend support)
- 2x1 Angle: $3,380 (secondary support)
- 1x2 Angle: $3,490 (resistance)
6. Ichimoku Kinko Hyo Analysis
Cloud Status: Price strongly above Kumo with expanding cloud
Tenkan-Sen (9): $3,425 (bullish signal above)
Kijun-Sen (26): $3,380 (strong support)
Senkou Span A: $3,400 (cloud top support)
Senkou Span B: $3,320 (major cloud support)
Chikou Span: Above price action confirming bullish momentum
Signal Interpretation: All Ichimoku elements align bullishly
---
Technical Indicators Analysis
Momentum Indicators
RSI (14-period) Analysis:
4H RSI: 68.5 (approaching overbought but still room)
Daily RSI: 72.3 (overbought but strong trend)
Weekly RSI: 78.2 (extended but not diverging)
Divergence Watch: No negative divergence observed
MACD Analysis:
Signal: Bullish crossover confirmed on all timeframes
Histogram: Expanding positive histogram
Momentum: Accelerating with no signs of weakness
Warning Level: Watch for divergence above $3,500
Volatility & Trend Strength
Bollinger Bands (20, 2):
Current Position: Upper band walk in progress
Band Configuration: Expanding bands indicating strong trend
Squeeze Analysis: Recent expansion from consolidation
Volatility: Increasing supporting continued move
Average True Range (ATR):
Daily ATR: $45-55 (elevated volatility)
Trend Strength: ATR expanding confirming strong trend
Stop Loss Guidance: Use 2x ATR for swing positions
Volume Analysis
Volume Weighted Average Price (VWAP):
Daily VWAP: $3,420 (key support)
Weekly VWAP: $3,350 (major support)
Volume Profile:
- High Volume Node: $3,200-$3,300
- Value Area High: $3,380
- Point of Control: $3,280
Volume Characteristics:
Accumulation Evidence: Higher volume on advances
Distribution Watch: Monitor volume above $3,480
Institutional Activity: Consistent buying support
Moving Average Configuration
Short-term Alignment:
EMA 21: $3,410 (immediate support)
EMA 50: $3,350 (intermediate support)
SMA 100: $3,280 (major trend support)
EMA 200: $3,180 (long-term trend support)
Golden Cross Status: All major averages in bullish alignment
---
Multi-Timeframe Trading Strategy
Intraday Trading Strategy (5M - 4H)
# Primary Bullish Scenario (70% Probability)
Long Entry Opportunities:
Entry 1: $3,420-$3,440 (VWAP support retest)
Entry 2: $3,380-$3,400 (previous resistance turned support)
Entry 3: $3,480+ breakout (momentum continuation)
Stop Loss Levels:
Aggressive: $3,380 (below key support)
Conservative: $3,350 (below VWAP support)
Take Profit Targets:
TP1: $3,480 (immediate resistance)
TP2: $3,520 (Fibonacci extension)
TP3: $3,550 (psychological level)
Risk-Reward Analysis: 1:3.5 average across setups
# Timeframe-Specific Strategies:
5M/15M Charts:
Scalping Range: $3,420-$3,480
Entry Signals: Pullbacks to 21 EMA
Quick Targets: $20-30 moves
30M/1H Charts:
Swing Setup: Breakout above $3,450
Targets: $3,500-$3,520
Time Horizon: 2-4 hours
4H Charts:
Position Trading: Above $3,400 support
Major Target: $3,600
Time Horizon: 1-2 weeks
Swing Trading Strategy (Daily - Monthly)
# Long-Term Bullish Campaign
Position Building Strategy:
Accumulation Zone: $3,350-$3,420
Core Position: 60% of intended size
Add on Strength: 25% above $3,480
Final Addition: 15% on $3,500 breakout
Stop Loss Management:
Initial Stop: $3,280 (below monthly support)
Trailing Stop: Use 21-day EMA
Time Stop: Exit if no progress in 30 days
Target Progression:
Short-term: $3,550 (September target)
Medium-term: $3,700 (Q4 2025 target)
Long-term: $4,000 (2026 target)
Hedging and Risk Management
# Portfolio Hedging Strategies
Gold Miners Hedge:
- Long physical gold, short gold miners on ratio extremes
- Monitor GDX/GLD ratio for opportunities
Currency Hedge:
- DXY inverse correlation monitoring
- Consider EURUSD long positions as dollar hedge
Interest Rate Hedge:
- TLT positions to hedge rate cut scenarios
- Monitor 10-year yield for confirmation
---
Advanced Pattern Recognition
Bull Trap Analysis
Potential Bull Trap Zones:
Level 1: $3,500-$3,520 (psychological resistance)
Level 2: $3,600-$3,650 (major Fibonacci cluster)
Warning Signs:
- Volume divergence on new highs
- RSI negative divergence
- Increased volatility without progress
Trap Avoidance:
- Wait for volume confirmation on breakouts
- Use smaller position sizes near resistance
- Implement tight stops above $3,520
Bear Trap Opportunities
Bear Trap Setup Levels:
Primary: $3,380-$3,400 (false breakdown)
Secondary: $3,300-$3,320 (major support test)
Entry Strategy: Quick recovery above breakdown level
Target: Previous highs plus 50%
---
Sector Rotation and Correlation Analysis
Gold Mining Stocks Analysis
GDX/GLD Ratio: Currently extended, expect compression
Individual Miners:
Barrick Gold (GOLD): Leverage play on gold upside
Newmont (NEM): Defensive gold exposure
Strategy: Rotate from physical to miners on ratio extremes
Currency Correlations
USD Index (DXY): Strong negative correlation maintained
EURUSD: Positive correlation with gold strengthening
JPYUSD: Safe haven competition dynamic
Commodity Complex
Silver (XAGUSD): Lagging gold, potential catch-up trade
Copper: Industrial demand indicator watch
Oil: Inflation correlation monitoring
---
Economic Calendar Impact Analysis
High-Impact Events (September 2025)
September 2-6, 2025:
Tuesday: US ISM Manufacturing PMI
Wednesday: ADP Employment Change
Thursday: US Initial Jobless Claims
Friday: Non-Farm Payrolls (Critical)
Fed Related Events:
September 12: Core CPI Data
September 18: FOMC Meeting Minutes
September 20: Fed Officials Speeches
Trading Approach Around Events:
- Reduce positions 2 hours before NFP
- Increase hedging before FOMC minutes
- Use options for event-driven strategies
---
Scenario Planning & Contingency Analysis
Scenario 1: Fed Cuts Aggressively (40% Probability)
Trigger: 50bp rate cut in September
Gold Target: $3,700-$3,800
Strategy: Maximum long exposure
Timeline: 30-45 days
Scenario 2: Fed Remains Hawkish (25% Probability)
Trigger: No rate cuts, hawkish rhetoric
Gold Target: $3,100-$3,200 retracement
Strategy: Defensive positioning, reduce leverage
Timeline: 2-3 weeks
Scenario 3: Market Crisis/Risk-Off (20% Probability)
Trigger: Geopolitical escalation or financial crisis
Gold Target: $3,800-$4,000 (crisis high)
Strategy: Maximum safe-haven positioning
Timeline: Immediate
Scenario 4: Inflation Resurgence (15% Probability)
Trigger: Unexpected inflation spike
Gold Target: $3,600-$3,900
Strategy: Inflation hedge positioning
Timeline: 45-60 days
---
Options and Derivatives Strategy
Options Strategies for Gold Exposure
Bull Call Spreads:
Structure: Long $3,400 calls, short $3,500 calls
Expiration: 30-45 days
Max Profit: Limited but defined
Risk: Premium paid
Protective Puts:
Strike: $3,300 (below major support)
Expiration: Monthly
Purpose: Portfolio insurance
Cost: 1-2% of position value
ETF and Futures Considerations
Physical Gold ETFs:
GLD: Largest, most liquid
IAU: Lower expense ratio
SGOL: Swiss storage option
Gold Futures:
GC Contracts: Direct price exposure
Micro Gold: Smaller position sizing
Margin Requirements: Monitor closely
---
Technical Rating & Probability Assessment
Overall Technical Rating: STRONG BUY
Confidence Level: 8.5/10
Timeframe Ratings:
Intraday (1H-4H): BUY (85% bullish)
Short-term (Daily): STRONG BUY (90% bullish)
Medium-term (Weekly): STRONG BUY (85% bullish)
Long-term (Monthly): BUY (75% bullish)
Key Bullish Catalysts:
1. Technical Breakout: Clean break above $3,400 resistance
2. Fed Policy: Rate cut expectations building
3. Momentum: All timeframes aligned bullishly
4. Volume: Confirming accumulation patterns
Bearish Risk Factors:
1. Overextension: RSI levels stretched on weekly charts
2. Fed Hawkishness: Potential policy surprise
3. Dollar Strength: DXY recovery could pressure gold
4. Profit Taking: Natural at psychological $3,500 level
---
Weekly Trading Plan & Execution
Week of September 2-6, 2025
# Monday-Tuesday: Consolidation Expected
Strategy: Accumulate on dips to $3,420-$3,440
Targets: $3,480 resistance test
Risk Management: Tight stops below $3,400
# Wednesday-Thursday: Event Risk Management
Strategy: Reduce leverage ahead of economic data
Focus: Defensive positioning pre-NFP
Opportunity: Post-event volatility trades
# Friday: NFP Reaction Strategy
Bullish NFP: Sell the news, expect pullback
Bearish NFP: Add to long positions aggressively
Neutral NFP: Continue trend-following approach
Position Sizing Recommendations
Conservative: 2-3% portfolio allocation
Moderate: 5-7% portfolio allocation
Aggressive: 8-12% portfolio allocation
Risk per Trade: Maximum 1% of total capital
---
Long-Term Investment Thesis
Secular Bull Market Drivers
Monetary Debasement: Continued fiat currency depreciation
Geopolitical Uncertainty: Ongoing global tensions
Central Bank Demand: Record official sector purchases
Supply Constraints: Limited new mine development
Price Targets by Timeline
Q4 2025: $3,600-$3,800
Q1 2026: $3,800-$4,200
End 2026: $4,200-$4,800
2027-2028: $5,000+ potential
Investment Allocation Strategy
Core Holdings: 40% physical gold/ETFs
Trading Position: 30% futures/options
Mining Exposure: 20% quality miners
Cash Reserve: 10% for opportunities
---
Risk Disclaimers and Considerations
Market Risks
Volatility Risk: Gold can experience sharp moves
Liquidity Risk: Reduced liquidity during market stress
Currency Risk: USD movements affect returns
Storage Risk: Physical gold storage considerations
Regulatory and Tax Implications
Tax Treatment: Different rules for physical vs. paper gold
Reporting Requirements: Large position disclosure rules
Regulatory Changes: Potential trading restrictions
Technical Analysis Limitations
Pattern Failure: Technical patterns can fail
Black Swan Events: Unexpected market shocks
Model Risk: Over-reliance on historical patterns
Execution Risk: Slippage and timing issues
---
Conclusion & Strategic Recommendations
Gold's technical picture presents one of the most compelling bullish setups in recent history. Gold closed August with a strong daily close in premium territory, pressing into the 3460–3480 supply zone, with bulls maintaining control of momentum as September opens.
Immediate Action Items:
1. Accumulate Positions: Use any dip to $3,400-$3,420 as buying opportunity
2. Manage Risk: Implement proper position sizing and stop losses
3. Monitor Fed Policy: Watch for dovish signals supporting further upside
4. Prepare for Breakout: Position for potential move to $3,550-$3,600
Key Success Factors:
Discipline: Stick to predetermined risk management rules
Patience: Allow patterns to develop fully
Flexibility: Adapt to changing market conditions
Diversification: Use multiple gold investment vehicles
The confluence of technical, fundamental, and sentiment factors creates a rare alignment supporting significantly higher gold prices. While short-term volatility is expected, the medium to long-term outlook remains decidedly bullish.
Final Rating: STRONG BUY with careful risk management
I am nothing
Penerbitan berkaitan
Penafian
Maklumat dan penerbitan adalah tidak dimaksudkan untuk menjadi, dan tidak membentuk, nasihat untuk kewangan, pelaburan, perdagangan dan jenis-jenis lain atau cadangan yang dibekalkan atau disahkan oleh TradingView. Baca dengan lebih lanjut di Terma Penggunaan.