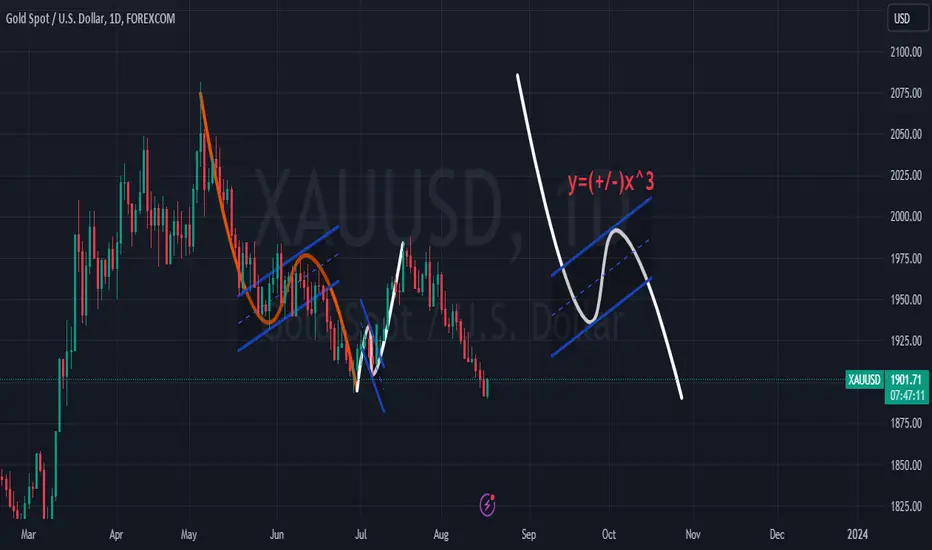
The curve represented by y=x^3 is highly regarded in financial charting. This particular graph is pivotal for various financial charts, notably in the gold and oil sectors. The chart often commences with a Hunt candle in a High High is typically positioned in a descending orientation and a Low Low is typically positioned in a ascending orientation.
Importantly, this graph can manifest in two conditions: when positive and rising, it aligns within an ascending channel, and when negative and falling, it is set within a descending channel. I've illustrated this in the gold chart in daily time frame.
Thus, investors should be on the lookout for either of these scenarios. If a downward trend is observed, it's advised to make a robust purchase at the base of the descending channel. Conversely, in the presence of an upward trend, a strong sell is recommended at the peak of the ascending channel.
Sincerely Yours,
MT
Dagangan ditutup: sasaran tercapai
Be careful about this pattern.MT
Penafian
Maklumat dan penerbitan adalah tidak dimaksudkan untuk menjadi, dan tidak membentuk, nasihat untuk kewangan, pelaburan, perdagangan dan jenis-jenis lain atau cadangan yang dibekalkan atau disahkan oleh TradingView. Baca dengan lebih lanjut di Terma Penggunaan.
Penafian
Maklumat dan penerbitan adalah tidak dimaksudkan untuk menjadi, dan tidak membentuk, nasihat untuk kewangan, pelaburan, perdagangan dan jenis-jenis lain atau cadangan yang dibekalkan atau disahkan oleh TradingView. Baca dengan lebih lanjut di Terma Penggunaan.