Gold surges and then falls, and there is still room for decline
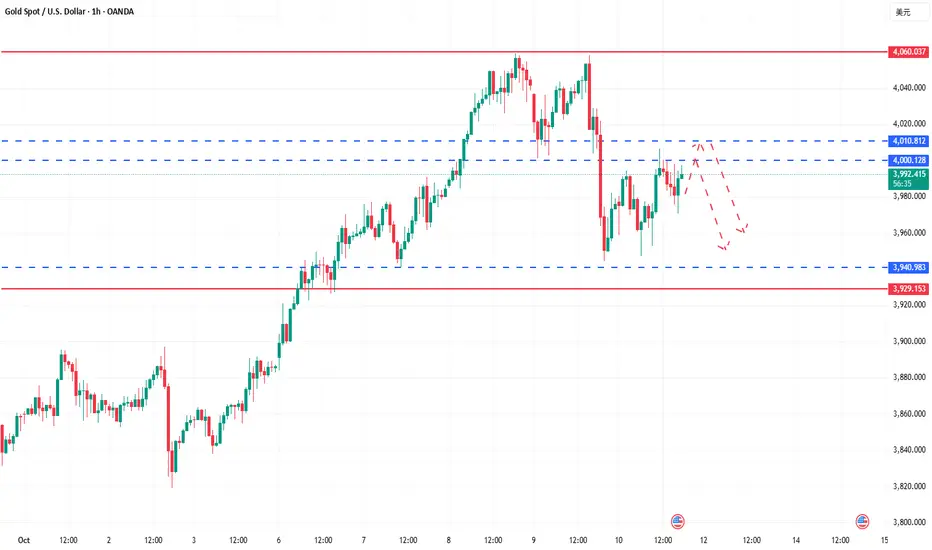
Gold Technical Analysis: Gold has finally seen its first pullback, falling from a high of 4058 to a low of 3944 yesterday, a drop of over 100 points. This marks the first pullback since the recent surge in gold prices. The main reasons for yesterday's sharp pullback were the strengthening US dollar and investors taking profits after the ceasefire agreement between Israel and Hamas. Gold prices continued to fall, ultimately failing to hold above 4000. The daily chart shows a dark cloud cover, with current resistance around 4000-4005, marking a turning point. Gold has formed a short-term double top.
Technically, the daily chart showed a sharp decline, forming a typical "yin enveloping yang" candlestick pattern. This pattern clearly indicates that the short-term market has shifted from its previous strong performance to a corrective trend. Following yesterday's sharp drop, gold prices have effectively broken through the 5-day moving average, effectively negating the short-term support. After today's opening, gold prices are temporarily trading between the 5-day and 10-day moving averages, entering a transitional consolidation range within the short-term moving average. Focus on the continuation of this correction today. Key support lies near the 10-day moving average, currently around 3920. This level will be a crucial indicator of whether the short-term market can stabilize. For today's market, we believe continued decline is likely, with a subsequent break below 4000 becoming a key dividing line between bulls and bears. If the market rebounds and rises above 4000, the market could turn higher. Conversely, below 4000 remains bearish. Key support lies below 3930-3920. A break below this would signal a breakdown of the current upward trend, ushering in a further acceleration of the downward trend. Of course, a weak market won't offer ideal short-selling opportunities. Currently, 3995 represents the 38.2% resistance level, also acting as resistance against the 5-day moving average. Furthermore, bearish moves are often very rapid, so hesitation will lead to a futile attempt. Therefore, in terms of operation, we were shorting above 4050 yesterday. Today, we suggest to continue to short below 4000, with the target at 3930. Once it breaks, it is time to add more positions! Overall, today's short-term operation strategy for gold is to focus on rebound shorting and callback longing. The short-term focus on the upper side is the 4000-4010 line of resistance, and the short-term focus on the lower side is the 3950-3940 line of support.
Technically, the daily chart showed a sharp decline, forming a typical "yin enveloping yang" candlestick pattern. This pattern clearly indicates that the short-term market has shifted from its previous strong performance to a corrective trend. Following yesterday's sharp drop, gold prices have effectively broken through the 5-day moving average, effectively negating the short-term support. After today's opening, gold prices are temporarily trading between the 5-day and 10-day moving averages, entering a transitional consolidation range within the short-term moving average. Focus on the continuation of this correction today. Key support lies near the 10-day moving average, currently around 3920. This level will be a crucial indicator of whether the short-term market can stabilize. For today's market, we believe continued decline is likely, with a subsequent break below 4000 becoming a key dividing line between bulls and bears. If the market rebounds and rises above 4000, the market could turn higher. Conversely, below 4000 remains bearish. Key support lies below 3930-3920. A break below this would signal a breakdown of the current upward trend, ushering in a further acceleration of the downward trend. Of course, a weak market won't offer ideal short-selling opportunities. Currently, 3995 represents the 38.2% resistance level, also acting as resistance against the 5-day moving average. Furthermore, bearish moves are often very rapid, so hesitation will lead to a futile attempt. Therefore, in terms of operation, we were shorting above 4050 yesterday. Today, we suggest to continue to short below 4000, with the target at 3930. Once it breaks, it is time to add more positions! Overall, today's short-term operation strategy for gold is to focus on rebound shorting and callback longing. The short-term focus on the upper side is the 4000-4010 line of resistance, and the short-term focus on the lower side is the 3950-3940 line of support.
Dagangan aktif
If you do not have the ability to respond flexibly to the market in trading, nor are you good at adjusting your trading thinking and rhythm in time with the market rhythm, you can pay attention to the bottom notifications for more specific operation details and strategy updates. Let us pursue more profits flexibly and stably in the unpredictable market!Dagangan ditutup: sasaran tercapai
If you do not have the ability to respond flexibly to the market in trading, nor are you good at adjusting your trading thinking and rhythm in time with the market rhythm, you can pay attention to the bottom notifications for more specific operation details and strategy updates. Let us pursue more profits flexibly and stably in the unpredictable market!I will give my all to every friend who follows me. Trust is rewarded with real results. I don't exaggerate my promises and only pursue steady and sustainable returns. Many people have already done it, and you can too. t.me/TP_Daniel666
Penafian
Maklumat dan penerbitan adalah tidak dimaksudkan untuk menjadi, dan tidak membentuk, nasihat untuk kewangan, pelaburan, perdagangan dan jenis-jenis lain atau cadangan yang dibekalkan atau disahkan oleh TradingView. Baca dengan lebih lanjut di Terma Penggunaan.
I will give my all to every friend who follows me. Trust is rewarded with real results. I don't exaggerate my promises and only pursue steady and sustainable returns. Many people have already done it, and you can too. t.me/TP_Daniel666
Penafian
Maklumat dan penerbitan adalah tidak dimaksudkan untuk menjadi, dan tidak membentuk, nasihat untuk kewangan, pelaburan, perdagangan dan jenis-jenis lain atau cadangan yang dibekalkan atau disahkan oleh TradingView. Baca dengan lebih lanjut di Terma Penggunaan.